
Figure 2.
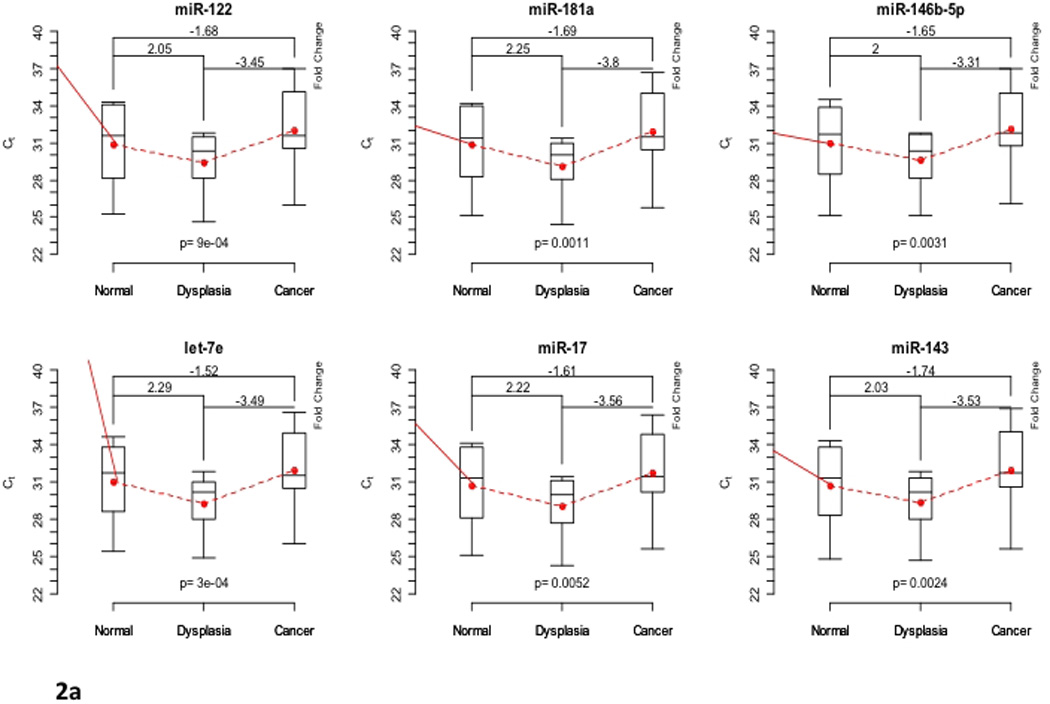

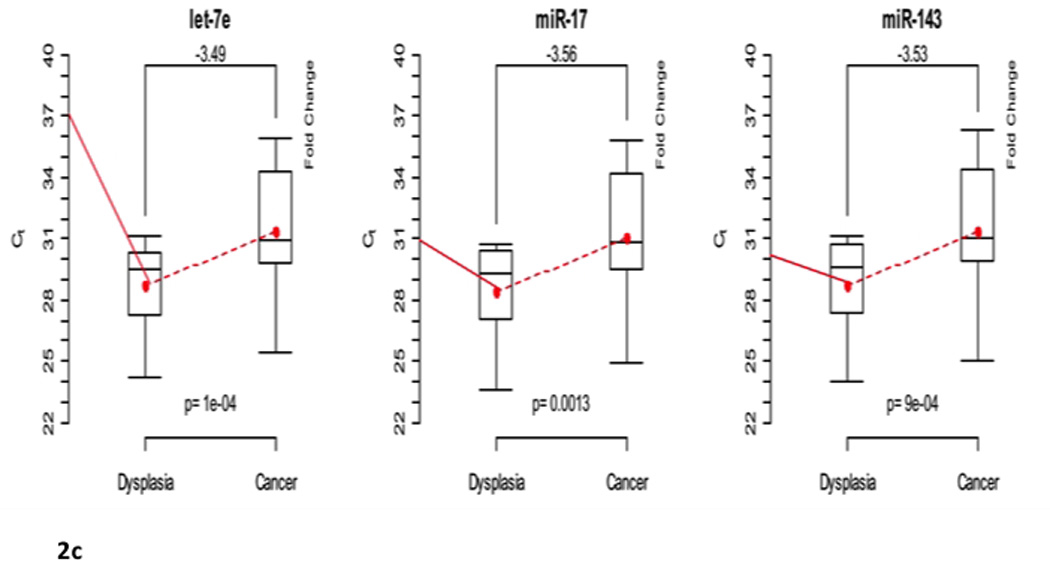
(a). Differentially expressed microRNAs in Crohn disease (CD) patients. Box plots showing the minimum and maximum (ends of the whiskers), the median (band near the middle of the box) and interquartile ranges for four patients. The bottom and top of the box plots represent the 25th and 75th percentile (lower and upper quartiles, respectively); three replicates were used for each sample. Dotted line shows the mean trend over stage across all patients and replicates with corresponding fold changes of raw data expression values. A higher cycle threshold (Ct) value implies a lower miRNA expression; thus, negative fold changes imply down-regulation. The fold changes from non-neoplastic tissue to dysplasia, dysplasia to cancer, and from non-neoplastic tissue to cancer are shown on top of the box plots, respectively. (b). Differentially expressed microRNAs in non-neoplastic tissue to dysplasia in Crohn disease patients. Box plots showing the minimum and maximum (ends of the whiskers), the median (band near the middle of the box) and interquartile ranges for four patients. The bottom and top of the box plots represent the 25th and 75th percentile (lower and upper quartiles, respectively); three replicates were used for each sample. Dotted line shows the mean trend over stage across all patients and replicates with corresponding fold changes of raw data expression values. A higher cycle threshold (Ct) value implies a lower miRNA expression; thus, negative fold changes imply down-regulation. The fold changes from non-neoplastic tissue to dysplasia are shown on top of the box plots, respectively. (c). Differentially expressed microRNAs in dysplasia to cancer in Crohn disease patients. Box plots showing the minimum and maximum (ends of the whiskers), the median (band near the middle of the box) and interquartile ranges for four patients. The bottom and top of the box plots represent the 25th and 75th percentile (lower and upper quartiles, respectively); three replicates were used for each sample. Dotted line shows the mean trend over stage across all patients and replicates with corresponding fold changes of raw data expression values. A higher cycle threshold (Ct) value implies a lower miRNA expression; thus, negative fold changes imply down-regulation. The fold changes from non-neoplastic tissue to dysplasia, dysplasia to cancer, and from non-neoplastic tissue to cancer are shown on top of the box plots, respectively. The fold changes from dysplasia to cancer are shown on top of the box plots, respectively.