
Figure 6.
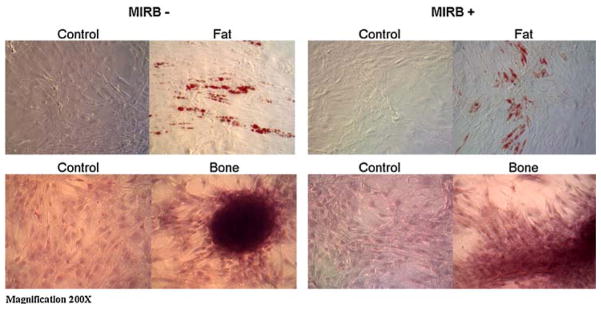
Light microscopy images of unlabeled and labeled (20 μg Fe/ml) MSC differentiation into fat (top) and bone (bottom). Control cells (both labeled and unlabeled) were not provided with adipogenic or osteogenic media.
Official websites use .gov
A
.gov website belongs to an official
government organization in the United States.
Secure .gov websites use HTTPS
A lock (
) or https:// means you've safely
connected to the .gov website. Share sensitive
information only on official, secure websites.
Light microscopy images of unlabeled and labeled (20 μg Fe/ml) MSC differentiation into fat (top) and bone (bottom). Control cells (both labeled and unlabeled) were not provided with adipogenic or osteogenic media.