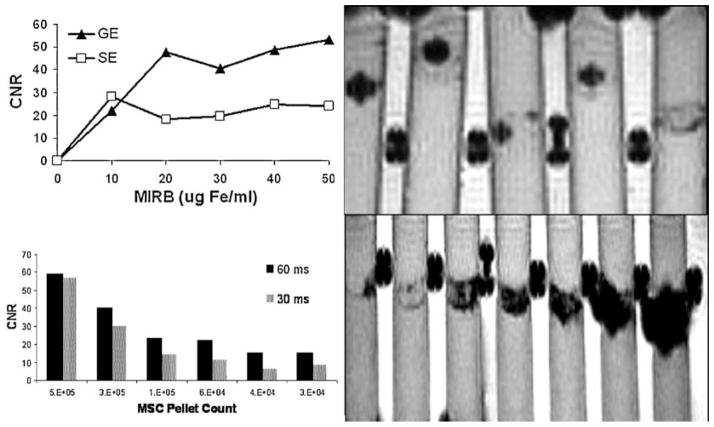
Figure 9.
CNR for SE and GE sequences for MSC pellets labeled at increasing MIRB concentrations (top left) and GE (500/60) image of phantom used with 5E4 MSC labeled with MIRB in concentrations (from left to right) of 50, 40, 30, 20, 10 μg Fe/ml (top right). CNR vs. MSC pellet cell count for MSC labeled with 20 μg Fe/ml (lower left) and GE (500/60) image of phantom set used with (from left to right) 1.25E4, 2.5E4, 3.75E4, 6.25E4,1.2E5, 2.5E5 and 5E5 MSC labeled with 20 μg Fe/ml (lower right).

