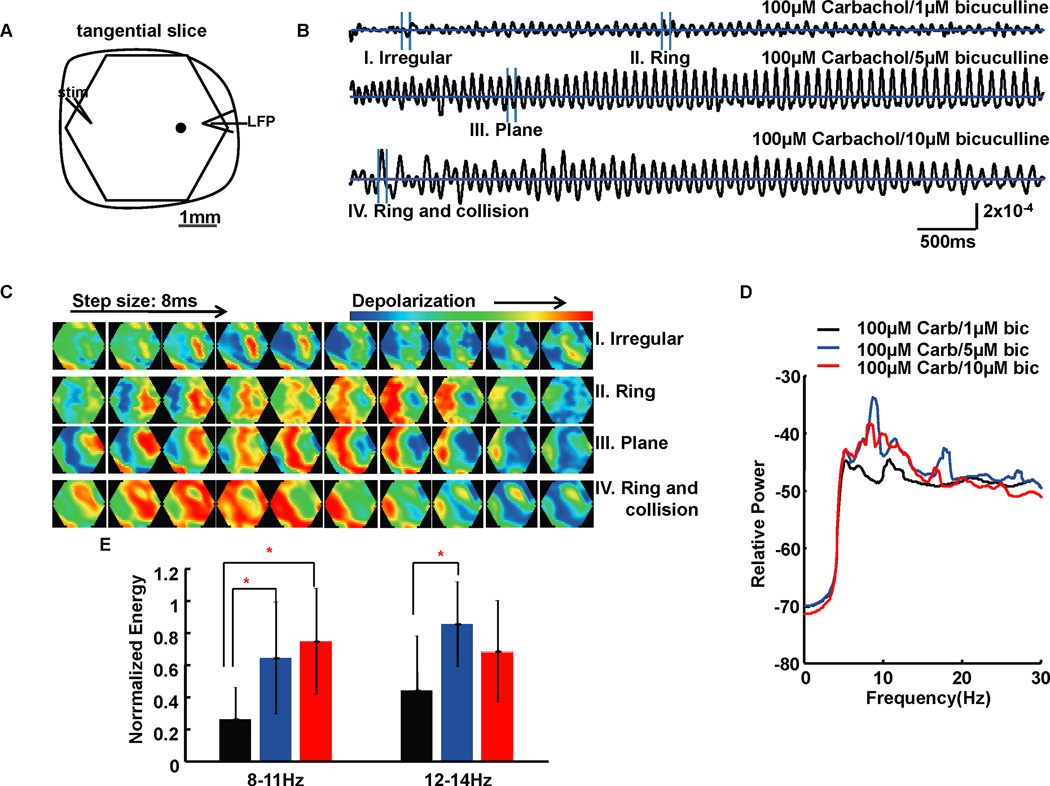
FIG. 2.
Results for bicuculline titration experiments. (A) Schematic drawing of imaging field (hexagonal) with a 4× objective overlying a 500µm thick tangential occipital cortical slice. The slice included layers 3–5. A 0.5ms 6mA single square wave electrical pulse was given at the edge of the slice as a stimulus (stim) to evoke oscillations. LFP at the edge of the slice was recorded simultaneously with the optical recordings. One example optical detector is indicated as a black filled circle within the imaging field. Data from optical detectors that are spatially close to the LFP recording electrode tip are needed to get filter criteria by coherency analysis before further analyses, while traces from optical detectors used to accompany the gray scale images are not required to be close to the LFP recording electrode tip. Signals measured at the picked detector are shown as six-second traces in (B). The horizontal lines in traces of B are zero baselines. Vertical scale: 2×10⁻⁴ of resting light intensity. (C) Four sections from the temporal data (I–IV) in B are displayed as a sequence of gray scale images. These gray scale images are displayed at 8 ms intervals between frames. (D) Power spectrum (logarithmic scale) for optical signals during a 6-second episode averaged across all detectors of 10 slice experiments. Carb: carbachol; bic: bicuculline. (E) Bar plot shows the average normalized energy in two frequency ranges corresponding to three bicuculline concentrations. Error bars represent ± standard deviation. Light gray, gray and black bars represent 1µM, 5µM and 10µM bicuculline, respectively. The 10µM bicuculline group had significantly higher energy at 8–11Hz than 1µM bicuculline group, while the 5µM bicuculline group had significantly higher energy at 8–11Hz and 12–14Hz than 1µM bicuculline group. The significant differences between groups in E are marked by asterisks (*).

