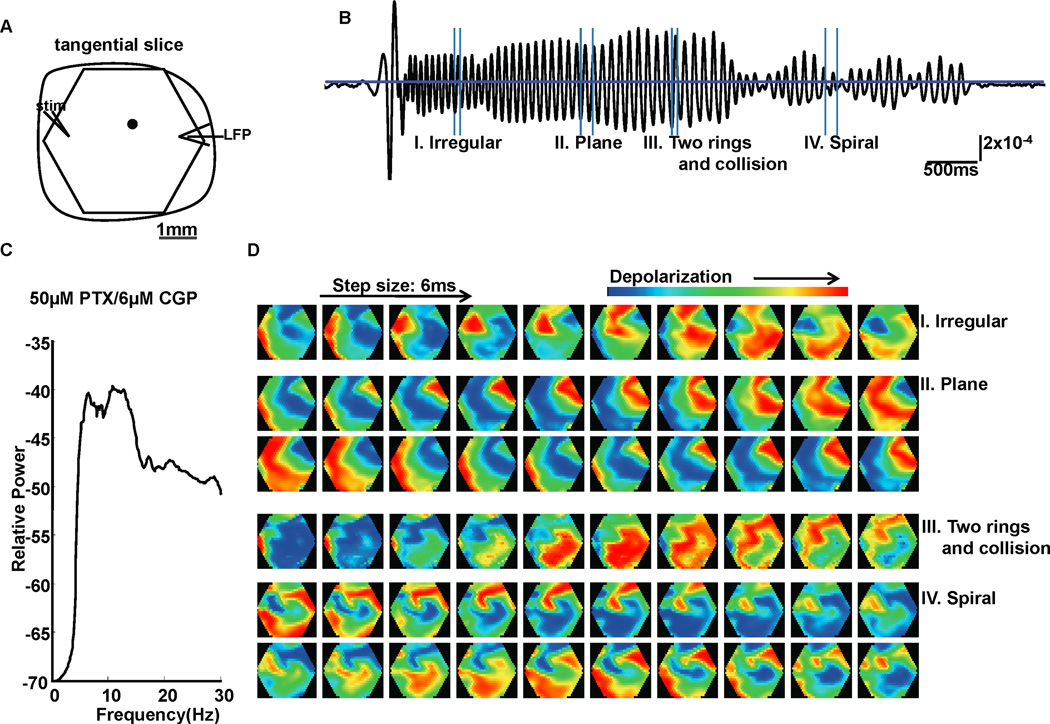
FIG. 6.
Oscillations evoked by combination of PTX and CGP52432. (A) Recording arrangement. Signal from one example optical detector (marked as a black filled circle in A) is shown in (B). Vertical scale: 2×10⁻⁴ of resting light intensity. (C) Power spectrum (logarithmic scale) for optical signals averaged from 7 slice experiments. The average peak frequencies were at about 6Hz and 11Hz. (D) Pattern examples of a 6-second oscillatory episode evoked with 50µM PTX/6µM CGP52432 in B. These gray scale images are displayed at 6 ms intervals between frames. In section III, responses that emerged at 2 locations in the imaging field developed into 2 connected rings and collided as the rings propagated.

