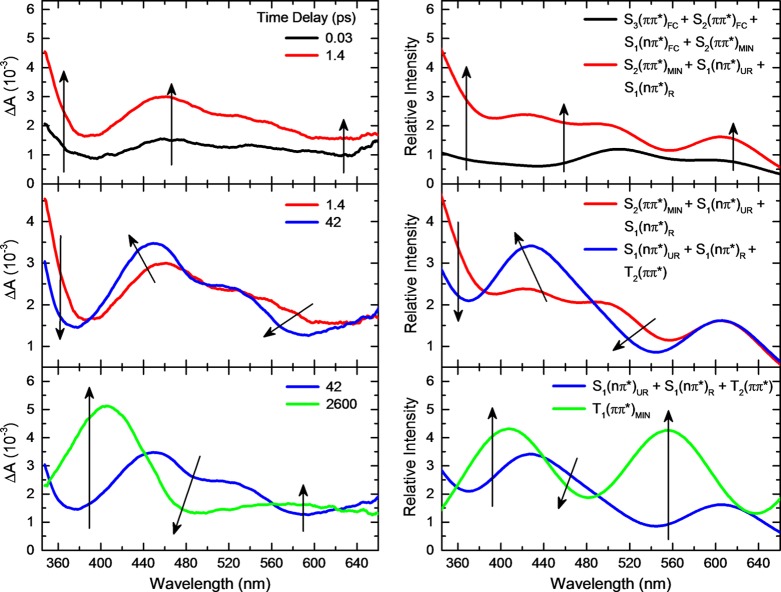
Figure 8.
Comparison of the experimental and simulated transient absorption spectra for 9-methylpurine at the specified time delays. Transient absorption spectra were simulated through a linear combination of the excited-state spectra at key points along the potential energy surfaces (see SI for full details). The intensity of each excited-state absorption spectrum was scaled based on its relative contribution to the dynamics at the specified time delay. The following linear combinations are shown in the right panel: 0.25 × (S3(ππ*)FC + S2(ππ*)FC + S1(nπ*)FC + S2(ππ*)MIN) at 0.03 ps; 0.42 × S2(ππ*)MIN + 0.15 × S1(nπ*)UR + 0.43 × S1(nπ*)R at 1.4 ps; 0.36 × S1(nπ*)UR + 0.52 × S1(nπ*)R + 0.12 × T2(ππ*) at 42 ps; and 1.00 × T1(ππ*)MIN at 2600 ps.

