Abstract
Study Objectives:
Obstructive sleep apnea-hypopnea (OAH) diagnosis in children is based on the quantification of flow and respiratory effort (RE). Pulse transit time (PTT) is one validated tool to recognize RE. Pattern analysis of mandibular movements (MM) might be an alternative method to detect RE. We compared several patterns of MM to concomittant changes in PTT during OAH in children with adenotonsillar hypertrophy.
Methods:
Participants: 33 consecutive children with snoring and symptoms/signs of OAH.
Measurements:
MMs were measured during polysomnography with a magnetometer device (Brizzy Nomics, Liege, Belgium) placed on the chin and forehead. Patterns of MM were evaluated representing peak to peak fluctuations > 0.3 mm in mandibular excursion (MML), mandibular opening (MMO), and sharp MM (MMS), which closed the mouth on cortical arousal (CAr).
Results:
The median (95% CI) hourly rate of at least 1 MM (MML, or MMO, or MMS) was 18.1 (13.2–36.3) and strongly correlated with OAHI (p = 0.003) but not with central apnea-hypopnea index (CAHI; p = 0.292). The durations when the MM amplitude was > 0.4 mm and PTT > 15 ms were strongly correlated (p < 0.001). The mean (SD) of MM peak to peak amplitude was larger during OAH than CAH (0.9 ± 0.7 mm and 0.2 ± 0.3 mm; p < 0.001, respectively). MMS at the termination of OAH had larger amplitude compared to MMS with CAH (1.5 ± 0.9 mm and 0.5 ± 0.7 mm, respectively, p < 0.001).
Conclusions:
MM > 0.4 mm occurred frequently during periods of OAH and were frequently terminated by MMS corresponding to mouth closure on CAr. The MM findings strongly correlated with changes in PTT. MM analysis could be a simple and accurate promising tool for RE characterization and optimization of OAH diagnosis in children.
Citation:
Martinot JB, Senny F, Denison S, Cuthbert V, Gueulette E, Guénard H, Pépin JL. Mandibular movements identify respiratory effort in pediatric obstructive sleep apnea. J Clin Sleep Med 2015;11(5):567–574.
Keywords: mandibular movements, pulse transit time, pediatric obstructive sleep apnea, respiratory effort
Mouth-breathing is a common clinical feature during sleep in children suffering from adenotonsillar hypertrophy. Mouth opening as a consequence of the lowering of the mandible is often observed when a child struggles to breathe against partial or complete upper airway obstruction.1,2 It is critical to identify during polysomnography (PSG) repetitive occur-rence of increased respiratory efforts (RE) that induce cortical and/or autonomic arousals.3–5 These events are a risk factor for cognition disturbances and growth impairment.6,7 Body position does not affect mandibular position. Normally the jaw is stabilized at a fixed position and the mouth is closed (or nearly closed) during sleep.8 In the presence of upper airway obstruction, submental muscles are recruited and can destabilize the mandibular position leading to mouth opening.9 If the jaw retracts, the distance between the mandible and hyoid bone decreases and upper airway muscles become less efficient in maintaining upper airway patency.10–12
Pulse transit time (PTT), defined as the interval between the ECG R-wave and the pulse detected with a digital oximeter, was previously identified during sleep as a reliable indicator of RE and cortical arousal (CAr) associated with upper airway obstruction in adults and in children.5,13,14 During inspiration against a closed airway, blood pressure declines due to negative intrathoracic pressure, resulting in an increase in PTT. On CAr, when the obstructive event terminates, PTT abruptly shortens.15 A change in PTT of at least 15 ms is considered a sensitive indicator of inspiratory effort.16 The occur-rence of a CAr with relief of upper airway obstruction is also marked by an abrupt mandibular movement (MM) leading to rapid closure of the mouth as the mandible assumes a clenched position.17
BRIEF SUMMARY
Current Knowledge/Study Rationale: The aim of the study was to explore the relationship between the mandibular movements observed during sleep in children with adenotonsillar hypertrophy and the presence of a respiratory effort assessed with the pulse transit time measurement.
Study Impact: Mandibular movements analysis is helpful to detect respiratory effort during sleep in children with upper airway obstruction. It could be considered as a sensitive tool to identify and characterise sleep disordered breathing in a simple way.
Detection of mandibular movement (MM) patterns is a new additional method to detect RE associated with obstructive sleep apnea-hypopnea (OAH) and microarousals. The normalization of RE, a main goal for OAH syndrome treatment, could be assessed more easily and accurately by monitoring mandibular position during sleep. As the method is simple, this reliable surrogate measure of RE and indirectly of arousal could be used instead of other invasive measurements. This is of crucial importance in children exhibiting limited oxygen desaturation and mainly increases in RE.
The purpose of this study was to determine whether MM identifies RE during OAH or flow limitation (FL), referenced to PTT. We recorded and analyzed MM in children with adenotonsillar hypertrophy and suspected OAH who underwent PSG prior to tonsillectomy. The temporal relationship between MM and PTT during OAH and central sleep apnea-hypopnea (CAH) was examined.18
METHODS
Subjects
All enrolled children were suspected to have sleep disordered breathing based on the history of snoring and physical examination by an otorhinolaryngologist. Signed informed consent was obtained from the parents. The study was performed according to the Declaration of Helsinki, approved by the Medical Ethics Committee of the Clinique et Maternité Sainte Elisabeth Namur Belgium (B166201215073), and all participants or legal representatives provided written informed consent prior to study commencement.
Polysomnography Recording
Routine laboratory-based PSG was recorded with a Dream Medatec device, Brussels, Belgium. The parameters monitored included EEG (Fz-A+,Cz-A+, Pz-A+), right and left electro-oculogram, submental EMG, tibial EMG, chest and abdominal wall motion by respiratory inductance plethysmography (SleepSense, S.L.P.Inc, St Charles, USA), nasal and oral flows, respectively, with a pressure transducer and a thermistor, and O2 saturation by digital oximeter displaying pulse wave form (Nonin, Nonin Medical, Plymouth, USA).
Mandibular Movements
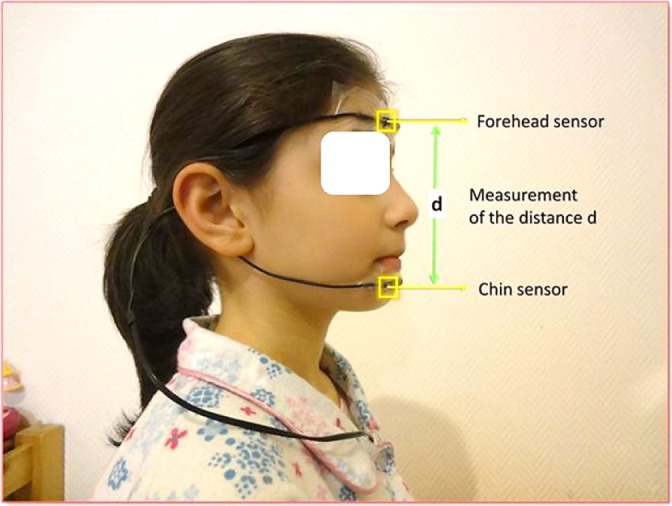
A midsagittal mandibular movement magnetic sensor (Brizzy Nomics, Liege, Belgium) measured the distance in mm between two parallel, coupled, resonant circuits placed on the forehead and on the chin (Figure 1). The transmitter generated a pulsed magnetic wave of low energy, at 10 Hz. The change in the magnetic field recorded at the receiver is inversely related to the cube of the distance between the chin and forehead probe. The probes were connected to an electronic module and a measure of the distance was computed before transmission to the PSG. The resolution of the measurement was 0.1 mm. The mandibular positions during each respiratory cycle were recorded in the breathing frequency band of 0.25–0.6Hz. The signal was interpreted as following: the more negative the value of the signal became, the lower the mandible position and the greater was mouth opening.
Figure 1. A midsagittal mandibular movement magnetic sensor (Brizzy Nomics, Liege, Belgium) measured the distance in mm between two parallel, coupled, resonant circuits placed on the forehead and on the chin.
Patterns of Mandibular Movements
Data published in adults19 and visual analysis of the traces in this study indicate that MM can be analyzed in 4 different ways depending on their amplitude and duration as shown in Table 1 and Figures 2, 3, and S1 (supplemental material).
Table 1.
MM analysis.

Figure 2. Schematic representation of the mandibular movements.
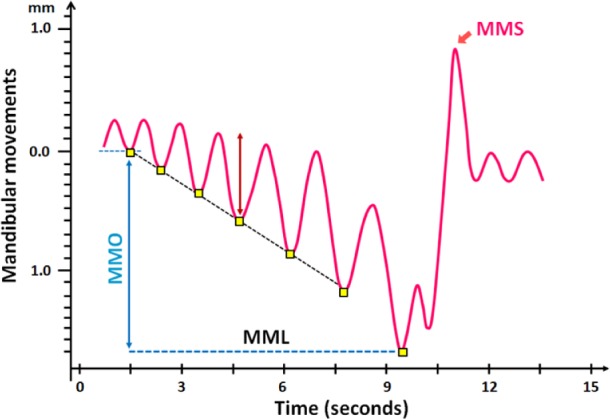
MML, peak to peak respiratory MM ≥ 0.3 mm; MMO, mouth opening; MMS, sharp and sudden MM.
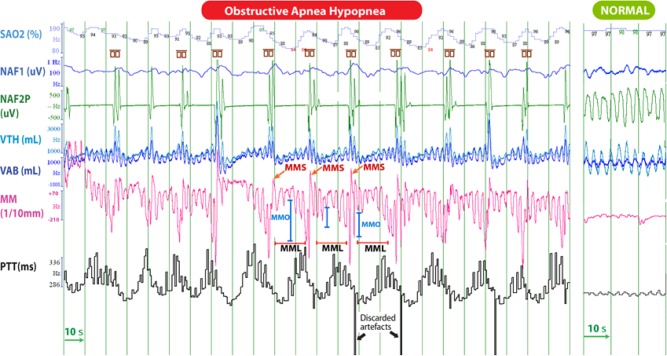
Figure 3A. Polysomnographic tracing of 4-min of stage N2 sleep, in a 12-year-old child with tonsillar hypertrophy, showing regular episodes of obstructive apnea-hypopnea.
When sampling the PTT signal at the same frequency as the MM signal and after adjustment for the lag of these signals, MM was highly correlated with PTT (Pearson r = 0.65; p < 0.001) in this patient; the more the mandible lowered during MMO, the more PTT lengthened. Cortical arousals are enclosed into the small brown symbols. On the right is a tracing during a quiescent period of normal respiration and little mandibular movement. SaO2, arterial oxyhemoglobin saturation; VTH and VAB; thoracic and abdominal inductance belts; NAF2P and NAF1, nasal pressure transducer and oronasal thermal flow sensor; MM, mandibular movements; PTT, pulse transit time; Phono, microphone sound; HR, heart rate; OAH, obstructive sleep apnea-hypopnea; MMS: sharp and sudden MM; MMC: peak to peak respiratory MM ≥ 0.3 mm; MMO: mouth opening.
The mandibular signal was then segmented using a continuous wavelet transform as previously described to identify sudden movements of high amplitude.19 Moreover the peak-to-peak amplitude of mandibular movement (excursion) during a respiratory cycle (inspiration and expiration) was measured by grayscale mathematical morphology.22,23 This mathematical computation creates an envelope around each mandibular movement coupled to the respiratory cycle in the segmented regions. The final results of mathematical morphology on the raw traces is shown in the supplemental material (Figure S2). The observation time window used in the algorithm was set at 4 seconds (0.25 Hz).
Pulse Transit Time
The ECG and oximetry waveforms were acquired at 200 Hz. The PTT was measured on a beat-by-beat basis as the interval between the R-wave of the Q complex to a threshold on the pulse waveform representing 50% of its height.18 Only artifact-free PTT waveforms were used for analysis. The differences between PTT measured during the respiratory cycle were assessed with the same morphological mathematic operators than for MM analysis to obtain the signal peak-to-peak amplitude. The differences between adjacent PTT values were captured by the envelope, and a change ≥ 15 ms was used to assess increased inspiratory effort. Missing data were filled in by linear interpolations. Changes > 50 ms were discarded as artifactual.
CAr were detected on EEG and reported as RE-related when they were synchronous with the termination of the respiratory event, while those without a preceding respiratory event were scored as spontaneous arousals.
Data Analysis and Scoring
All respiratory events were scored separately by 2 experienced observers who were blinded to the mandibular and the PTT records according to the American Academy of Sleep Medicine rules for the scoring of sleep and associated events reported in 2012.24 Detection of RE was based on the monitoring of out-of-phase thoraco-abdominal excursions with an un-calibrated respiratory inductance plethysmography and/or on the flattening of the inspiratory portion of the nasal pressure wave form often associated with snoring.24 Visual analysis of the PTT signal allowed the observers to discard artifacts produced by the motion of the oximeter probe during movement (usually associated with an arousal).
Mixed apneas or hypopneas were included in the obstructive sleep apnea-hypopnea index (OAHI). Central apneas or hypopneas detected in NREM sleep were used for comparison with the same randomly selected number of obstructive sleep apneas-hypopneas (OAH) occurring during this sleep stage. These were exported into a spread sheet and analyzed with morphological mathematical computation. The average of MM was calculated from the envelope around the signal. The comparative analysis was performed during the last 10 seconds of the OAH and CAH events and following CAr.
Statistical Methods
Data were analyzed using IBM-SPSS statistical software for Windows (Version 20.0) and the “R” software.23 Variables were expressed as median and 95% CI. A p value ≤ 0.05 was considered statistically significant. The Spearman coefficient and regression plot were used to study the relationship between the mandibular indices and other variables on PSG. The statistical distributions of the means of MM amplitudes from peak to peak were computed to compare CAH and OAH both during the last 10 s of the event and on CAr. These distributions were displayed in a box plot graph with the median, the 2nd, and 3rd quartiles, in addition to the 5th and 95th percentiles. ANOVA and MANOVA statistical tests were used to compare these distributions. The temporal relationship between MM and PTT peak-to-peak amplitude changes was assessed with Pearson correlation.
RESULTS
Study Population
The records of 33 children (2–16 years of age), recruited consecutively over a period of 6 months for PSG before tonsil-lectomy, were analyzed. All children were habitual snorers and mouth-breathers, and all showed an elevated apnea-hypopnea index. They were free of craniofacial or neuromuscular disorders. The characteristics of the cohort and the main polysomnographic outcomes are reported in Table 2. There was a predominance of males, with a median age of 5.0 years in all participants. Three children who had no respiratory events outside stage REM were not included in the comparative analysis with PTT, which was restricted to NREM sleep.
Table 2.
Characteristics and main polysomnographic results of the group studied.
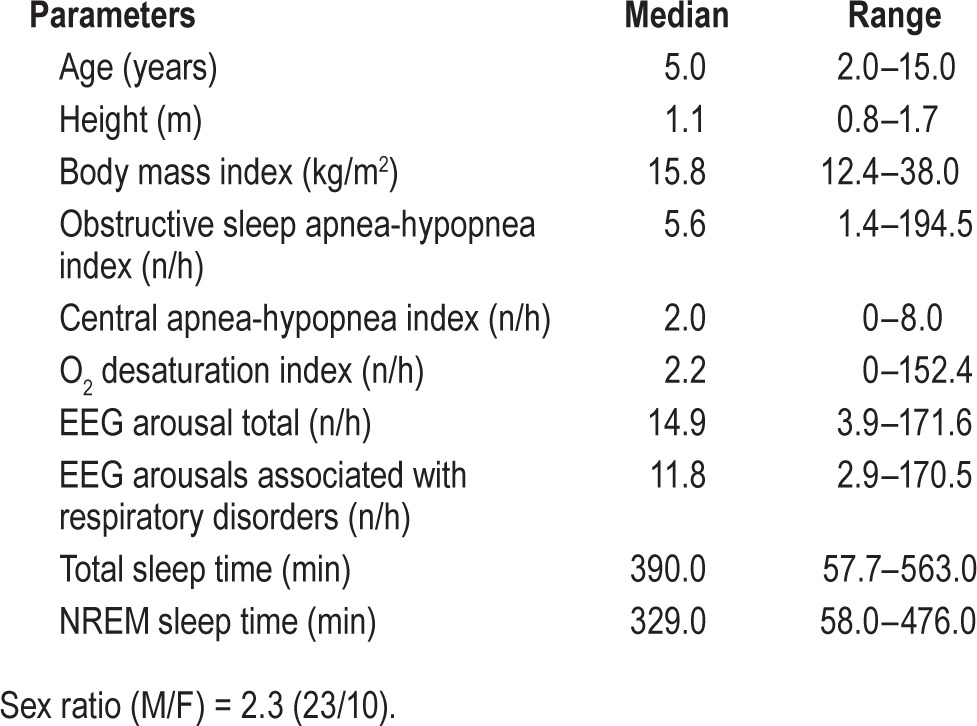
For the whole population, a total of 1,731 OAH and of 387 CAH events were scored during 193 hours of cumulated sleep time. Of a median total sleep time of 390 min, median time spent in NREM was 329 minutes. Most sleep events scored were OAH with a median (95% CI) of 5.6 (6.4–11.3) events per hour. Overall, 94% of OAH were associated with MM compared to 47% of CAH. The hourly MM index median (95% CI) was 18.1 (13.2–36.4). When MM were not associated with OAH, RERA, or CAH events, they were isolated (7%) or related to a period of FL, although not ended by a CAr (19%). Most CAr were associated with RE (95.1%).
Patterns of Mandibular Movements
Periods ≥ 2 respiratory cycles with MM ≥ 0.3 mm (MML) were observed predominantly during periods of OAH as shown in Figure 3A. This MML pattern was also associated with lowering of the mandibular end-inspiratory position, resulting in periods of mouth opening (MMO) until the occur-rence of a CAr.
MML
The median (95% Cl) hourly occurrence of MML was 7.7 (4–25.9) and greater than the median OAHI (5.6/h) as shown in Tables 2 and 3. The vast majority of MML were associated with OAH (54.9%) or flow limitation episodes (44.7%) with (RERA) or without CAr, with only 7 MML seen with CAH. The mean duration of periods of MML was 131.9 ± 82.4 s.
Table 3.
Mandibular movements (manual scoring) in the group (n = 33 children).

MMO
The median (95% CI) hourly rate of MMO was 4.4 (3, 2–9.7) and the mean amplitude of mouth opening during periods of MMO was 6.9 ± 1.6 (mm). MMO periods were predominantly observed in presence of OAH (51%) or flow limitation (47%; Table 3).
MMS
Sharp mandibular movements (MMS) occurred at a median (95% CI) rate/h of 16.4 (11.9–31.1), with 42% associated with OAH, 44% with flow limitation, and only 14% associated with CAH (Table 3). The number of MMS during the NREM and REM sleep was 1,672 and 1,501 and associated with RE in 1,416 (85%) and 13,37 (89%), respectively. Thus observation of a MMS was a robust marker for CAr, associated with OAH or FL whatever the period of sleep examined.
Combined Patterns of MM
Combinations of MML, MMO, and MMS were an even stronger predictor of obstructive nature of respiratory events. MMO and/or MML were all concomitant to OAH or periods of flow limitation (Table 3).
Correlations of MM Patterns with Other Sleep Indices
The rate of MM/h (MML or MMO or MMS) correlated significantly with (1) the OAHI (Spearman rho = 0.511; p = 0.003), and (2) the index of CAr due to OAH (Spearman rho = 0.655; p < 0.001). MMS/h significantly correlated with the OAHI (Spearman rho = 0.499; p < 0.001). The almost constant oc -currence of MMS at the end of periods of MML and/or MMO was reflected in the significant association between the rate of MMS and MML and/or MMO (Spearman rho 0.82; p < 0.001).
MM Patterns Comparison during CAH and OAH (Figure 4)
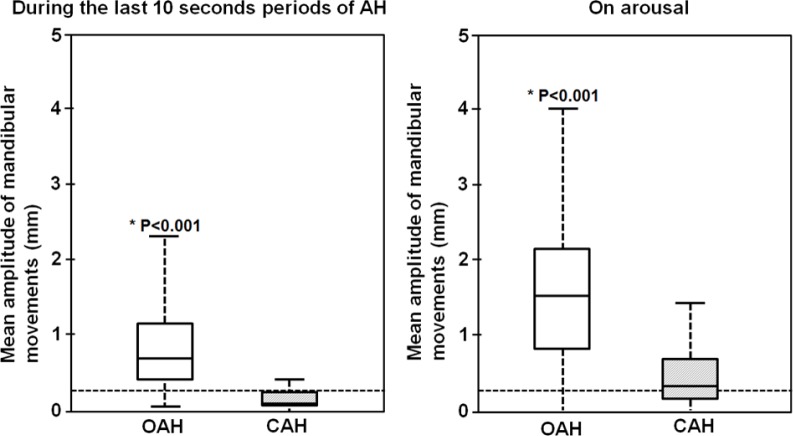
Figure 4. Box and whisker plots of the mean envelop of mandibular movements during the last 10 seconds periods of AH and on the subsequent arousals from 214 randomly selected obstructive and 214 identified central apneic events.
The horizontal dotted lines show a threshold of 0.3 mm for the peak to peak mandibular movement's amplitude changes that defines a MML; the box height is the interquartile range (25%–75%); the solid line in each box corresponds to the median; the whiskers represent the 5 and 95% percentiles. *The p values indicate the statistical difference between OAH and CAH events during the last ten seconds of apnea-hypopnea periods and on arousal. OAH, obstructive sleep apnea-hypopnea; CAH, central sleep apnea-hypopnea; AH, apnea-hypopnea.
MM patterns during the 214 CAH episodes identified in NREM sleep and 214 OAH episodes randomly sampled were averaged with mathematical morphology within the same NREM sleep period from 30 PSG recordings. Two periods were examined: the last 10 s of apnea-hypopnea and CAH and during the CAr.
Mean ± SD MML was 0.9 ± 0.7 mm for OAH compared to 0.2 ± 0.3 mm for CAH, p < 0.001. When MML are observed, PTT was ≥ 15 ms in 75% of the sample. On CAr following OAH and CAH, mean ± SD MMS were 1.5 ± 0.9 mm and 0.5 ± 0.7 mm, p < 0.001, respectively.
Visual analysis of these episodes showed that MML were present in 98% of the 214 OAH episodes, accompanied by a change in PTT ≥ 15 ms in 77% of these. MML or MMO were rarely seen during CAH in this subset.
Durations of MM Pattern Abnormality (Figure 5)
Figure 5. Relationship between the period of NREM sleep times (minutes) during which PTT changes from one cardiac beat to the other and mandibular movement's peak to peak amplitudes are, respectively, > 15 msec and 0.4 mm in 33 children (r = 0.86 p < 0.001).
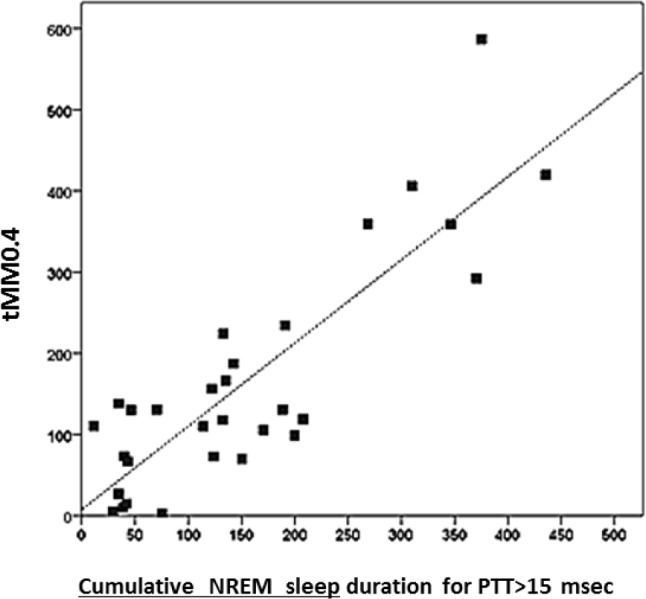
Total durations with MM greater than 0.4 mm (tMM0.4) showed the strongest correlation with PTT changes > 15 ms (Spearman rho = 0.71 p < 0.00001), with lesser but significant correlations for MM0.3 (Spearman rho 0.46; p = 0.009) and for MM0.5 (Spearman rho 0.6; p = 0.0004). A PTT threshold change value > 15 ms is considered as a cutoff in adult and in children indicating significant RE against upper airway obstruction when compared to changes in esophageal pressure.14
DISCUSSION
The main finding of this study is that several patterns of MM during sleep in children with upper airway obstruction highly correlated with increased RE during upper airway obstruction. Firstly, peak-to-peak movements of the mandible in consecutive obstructed breaths were temporally associated with PTT increase (Figure 3A). Secondly, when CAr occurred and relieved the obstruction, the mandible elevated with an abrupt movement (MMS) easily distinguished from the normal basal motion driven by respiratory cycles (Figure 3A). This abrupt movement accompanied the decrease in PTT, which is indicative of both the CAr and the return to normal intrathoracic pressure (Figure 3B).
Figure 3B. Magnified traces of a single OAH event.
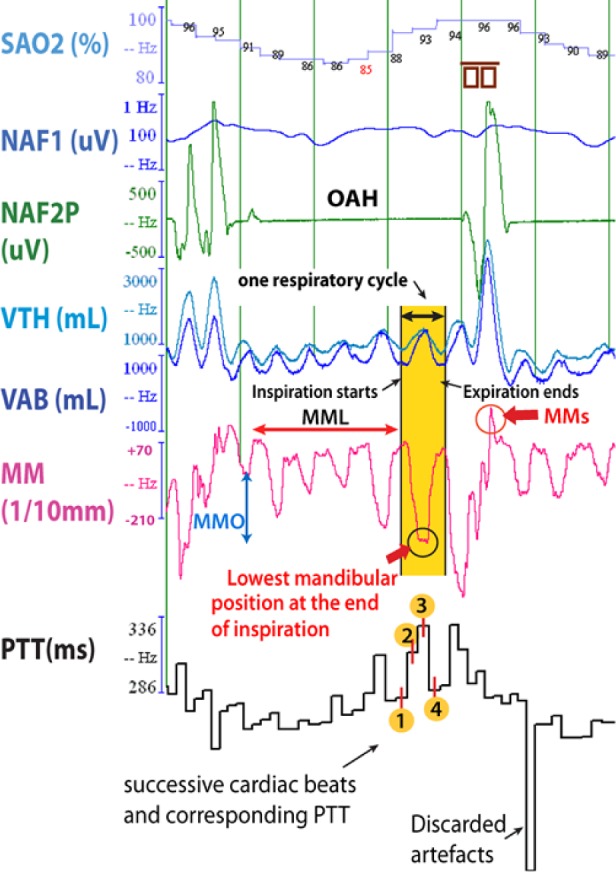
The abbreviations are the same as described in Figure 3A.
We observed that mandibular position changes, with increased upper airway resistance during the respiratory cycle as exhibited by mandibular lowering and jaw opening at end inspiration. The mandible is the anchor for upper airway muscles that dilate and elongate the pharynx and its position determines mouth opening. In normal sleep the mouth is closed or nearly closed but is slightly open during REM and deep NREM stages by comparison with light NREM periods of sleep.9 In OAH, the mandible lowers to a greater degree than normal sleep due to activation of the upper airway muscles allowing traction on hyoid bone and mouth opening to facilitate mouth breathing. However, this lowering of the mandible comes at the price of narrowing the pharyngeal airway. On CAr, the masseters close the jaw, increase the distance between the mandible and the hyoid bone, and enlarge the upper airway.8,9
Based on the peak-to-peak displacement of the mandibular position signal, 3 abnormal patterns of the mandibular movement during sleep could be described (Figures 3A and 3B). Pattern 1 consists of readily identifiable respiratory mandibular movements ≥ 0.3 mm) from the end inspiration to the end expiration of a respiratory cycle with some variability between cycles and called MML. This pattern occurs during the OAH and reflects progressive obstruction.25 Pattern 2 is an abrupt mandibular movement (MMS) of variable amplitude ≥ 200% of the previous or ensuing position. When CAr occurs, one or successive mandibular movements ≥ 1 mm disrupted the mandibular signal. Pattern 3 corresponds to the opening of the mouth assessed with the lowest position of the mandible recorded at the end of the period of effort just before arousal ending the respiratory events (MMO).
MM index is strongly correlated with the OAHI and not with CAHI. The median MM index (n/hour) was higher than OAHI also reflecting the increase of RE during long run of upper airway resistance episodes. This is mainly due to the changes in mandibular position during periods of flow limitation characterized by flattening of the inspiratory portion of the nasal pressure when the sequence of breaths does not meet criteria for OAH. This is of particular importance in children. As upper airway collapsibility is increased in children compared to adults,26,27 this type of events are significantly more frequent but difficult to assess and quantify. The present results are promising regarding the capability of MM to measure the overall increase in RE during sleep in children with OAH or upper airway resistance syndrome (UARS).
The MMS index (n/hour) is also correlated with the OAHI and can serve as an indicator of CAr as previously reported.28 However, it remains unclear whether the observed abrupt mandibular movements at the time of CAr is due to general motor restlessness or marks the end of RE attempting to overcome upper airway obstruction.18 MMS were also strongly associated with MML, indicating its close relationship with the previous period of RE, although CAr are less frequently observed in children than in adults (by comparison with autonomic activation) due to prematurity in the hierarchical response to arousal.29,30
Mandibular position and PTT were analyzed during periods of 4 minutes when the obstructive events were cyclically repeating (Figure 3A). Since PTT increase and its abrupt decrease on CAr is believed to reflect RE against upper airway obstruction, we hypothesized that the mandible would not display MM depicted in Pattern 2 during central apnea and that the association between MM and PTT the signals would not be present during central events.16 Mean changes of mandibular position are shown during OAH and CAH and during subsequent arousal (Figure 4). MMS are significantly larger and more variable during OAH compared to CAH. This suggests that recruitment of muscular activity determining mandible position is more pronounced when RE is increased.16,31,32 MM during OAH is accompanied by mean changes in PTT ≥ 15 ms.
A high significant correlation between sleep time with peak-to-peak amplitude MM > 0.4 mm and sleep time during which beat-to-beat PTT changes > 15 ms is shown in Figure 5, the greater the movement of the mandible, the greater the increase in PTT.
The close association between PTT and the mandible signals provides evidence that mandibular movements during sleep reflect the magnitude of RE to breathe against upper airway obstruction.4 A displacement of the mandible driven by respiration of 0.9 mm ± 0.7 peak-to-peak distance (mean ± SD) with a quartile distribution ≥ 0.3 mm in 75% of the sample was observed when PTT increases by ≥ 15 ms (Figure 4). This increase in PPT is known to occur when intrathoracic pressure decreases significantly during inspiration.15
Limitations of the Study
The sample size was quite small but gave adequate power to support the conclusion in this report, as each child had both OAH and CAH events and the number of events contributed to the statistical power. However, further validation of our findings is recommended.
The way we elected to estimate RE in the absence of esophageal monitoring was PTT; PTT analysis was restricted to the NREM periods during which the pulse photo-plethysmogram was correctly displayed. During REM sleep, rapid changes in respiratory drive during phasic periods lead to unpredictable respiratory efforts.33 Moreover REM is known to reduce the MM due to muscle atonia. Thus during REM, both PTT and MM were presumed to be less optimal for establishing a relationship between RE and MM. Nevertheless, the mandible in REM sleep remains a sensitive indicator of RE.
The position of the mandible during the respiratory cycle can be monitored continuously during the respiratory cycle but in contrast PTT is not a continuous variable since it is linked to heart beat. This “under-sampling” of the respiratory effort by PTT measurement is unavoidable but is reduced by averaging the amplitude of change in PTT in the distribution analysis and by the computation of the time spent over the whole night during which PTT change was > 15 ms.
Esophageal manometry was not performed here as the gold standard for RE because this is a relatively invasive procedure in children. Moreover the esophageal catheter itself could induce sleep fragmentation and could modify local reflexes from the pharynx and airway patency.
The effects of bruxism on the mandibular records during sleep have been reported previously.31 No bruxism was reported by the parents of the child during the baseline evaluation with the ENT, but this was not a focus of our study. In consequence, no additional masseter electrodes were used during PSG. Further studies in the field should consider using masseter electrodes.
CONCLUSIONS
To complement visual analysis of the thoracic and abdominal belt signals, the detection of RE during routine PSG can be assessed by monitoring mandibular position. Changes > 0.4 mm in mandibular position during the respiratory cycle indicate enhanced respiratory effort and align with changes in PTT. Mouth opening during respiratory effort (MMO) is also a feature for RE during OAH and flow limitation. Abrupt MMS also signify CAr with sudden mouth closure as the upper airway becomes patent and are larger in OAH compared to CAH. This method might be useful in the laboratory as well as in the home monitoring situation. This method might be particularly interesting in children for assessing not only apneas and hypopneas but also long run of increased respiratory effort before and after tonsillectomy.
DISCLOSURE STATEMENT
This was not an industry supported study. The authors have indicated no financial conflicts of interest.
ACKNOWLEDGMENTS
The authors wish to thank Dr. Philip E. Silkoff who revised the article critically for intellectual content.
ABBREVIATIONS
- CAH
central sleep apnea-hypopnea
- CAHI
central apnea-hypopnea index
- CAr
cortical arousal
- FL
flow limitation
- MM
mandibular movements
- MML
period ≥ 2 respiratory cycles during which peak to peak MM is ≥ 0.3 mm and terminating with an arousal
- MMO
period ≥ 2 respiratory cycles during which MM lead to a mouth opening of ≥ 0.3 mm and terminating with an arousal
- MMS
sharp and sudden movement of the mandible ≥ 1 mm or twice above the average of the previous mandibular movements
- OAH
obstructive sleep apnea-hypopnea
- OAHI
obstructive sleep apnea-hypopnea index
- PSG
polysomnography
- PTT
pulse transit time
- RE
respiratory effort
- RERA
respiratory effort related arousal
- UA
upper airway
SUPPLEMENTAL MATERIAL
1, 2, 3 are obstructed breaths. 4 is a breath on a cortical arousal. From 4 to 5, a central apnea. 5, 6 are obstructed breaths. SAO2, arterial oxyhemoglobin saturation; VTH and VAB; thoracic and abdominal inductance belts; NAF2P and NAF1, nasal pressure transducer and oronasal thermal flow sensor; MM, mandibular movements; PTT, pulse transit time; PHODB, microphone sound.
The opening and closing operators are applied first (upper graph). The difference between the operators is then smoothed to get the peak-to-peak amplitude of mandibular movements (middle graph). Finally, the MML periods (lower graph) are delimited outside MMS by using wavelet transform if the peak-to-peak displacement is greater than a predetermined threshold for ≥ 5 seconds.
The box height is the interquartile range (25%–75%); the solid line in each box corresponds to the median; the whiskers represent the 5 and 95% percentiles of the PTT (in ms). *The p value indicates the statistical difference between OAH and CAH events during the last ten seconds of apnea-hypopnea periods. The horizontal dotted line shows a threshold of 15 ms for the change in PTT. PTT, pulse transit time; AH, apneahypopnea; OAH, obstructive sleep apnea-hypopnea; CAH, central sleep apnea-hypopnea.
The first part of the fragment shows an unchanged mandibular position. By contrast, when flow limitations occurred—as illustrated by changes in nasal pressure, in synchrony with belt signal and microphone sound—the peak-to-peak mandibular movement increased above 0.3 mm as well as the inspiratory PPT until microarousal occurred. SaO2, arterial oxyhemoglobin saturation; VTH and VAB, thoracic and abdominal inductance belts; NAF2P and NAF1, nasal pressure transducer and oronasal thermal flow sensor; MM, mandibular movements; PTT, pulse transit time; Phono, microphone sound. A cortical arousal is enclosed into the small brown symbols. On the right is a tracing during a quiescent period of normal respiration and little mandibular movement.
REFERENCES
- 1.Guilleminault C, Pelayo R. Sleep-disordered breathing in children. Ann Med. 1998;30:350–6. doi: 10.3109/07853899809029934. [DOI] [PubMed] [Google Scholar]
- 2.Guilleminault C, Pelayo R, Leger D, Clerk A, Bocian RC. Recognition of sleep-disordered breathing in children. Pediatrics. 1996;98:871–82. [PubMed] [Google Scholar]
- 3.Halbower AC, Ishman SL, McGinley BM. Childhood obstructive sleep-disordered breathing: a clinical update and discussion of technological innovations and challenges. Chest. 2007;132:2030–41. doi: 10.1378/chest.06-2827. [DOI] [PubMed] [Google Scholar]
- 4.Gleeson K, Zwillich CW, White DP. The influence of increasing ventilatory effort on arousal from sleep. Am Rev Respir Dis. 1990;142:295–300. doi: 10.1164/ajrccm/142.2.295. [DOI] [PubMed] [Google Scholar]
- 5.Pépin JL, Delavie N, Pin I, et al. Pulse transit time improves detection of sleep respiratory events and microarousals in children. Chest. 2005;127:722–30. doi: 10.1378/chest.127.3.722. [DOI] [PubMed] [Google Scholar]
- 6.Chervin RD, Ruzicka DL, Giordani BJ. Sleep-disordered breathing, behavior, and cognition in children before and after adenotonsillectomy. Pediatrics. 2006;117:769–78. doi: 10.1542/peds.2005-1837. [DOI] [PMC free article] [PubMed] [Google Scholar]
- 7.Beebe DW, Rausch J, Byars KC, Lanphear B, Yolton K. Persistent snoring in preschool children: predictors and behavioral and developmental correlates. Pediatrics. 2012;130:382. doi: 10.1542/peds.2012-0045. [DOI] [PMC free article] [PubMed] [Google Scholar]
- 8.Hollowell DE, Suratt PM. Mandible position and activation of submental and masseter muscles during sleep. J Appl Physiol. 1991;71:2267–73. doi: 10.1152/jappl.1991.71.6.2267. [DOI] [PubMed] [Google Scholar]
- 9.Miyamoto K, Ozbek MM, Lowe AA, et al. Mandibular posture during sleep in patients with obstructive sleep apnoea. Arch Oral Biol. 1999;44:657–64. doi: 10.1016/s0003-9969(99)00057-6. [DOI] [PubMed] [Google Scholar]
- 10.Wiegand DA, Latz B, Zwillich CW, Wiegand L. Upper airway resistance and geniohyoid muscle activity in normal men during wakefulness and sleep. J Appl Physiol. 1990;69:1252–61. doi: 10.1152/jappl.1990.69.4.1252. [DOI] [PubMed] [Google Scholar]
- 11.Lavie P. Rediscovering the importance of nasal breathing in sleep or, shut your mouth and save your sleep. J Laryngol Otol. 1987;101:558–63. doi: 10.1017/s0022215100102245. [DOI] [PubMed] [Google Scholar]
- 12.Meurice JC, Marc I, Carrier G, Sériès F. Effects of mouth opening on upper airway collapsibility in normal sleeping subjects. Am J Respir Crit Care Med. 1996;153:255–9. doi: 10.1164/ajrccm.153.1.8542125. [DOI] [PubMed] [Google Scholar]
- 13.Argod J, Pépin JL, Lévy P. Differentiating obstructive and central sleep respiratory events through pulse transit time. Am J Respir Crit Care Med. 1998;158:1778–83. doi: 10.1164/ajrccm.158.6.9804157. [DOI] [PubMed] [Google Scholar]
- 14.Katz ES, Lutz J, Black C, Marcus CL. Pulse transit time as a measure of arousal and respiratory effort in children with sleep-disordered breathing. Pediatr Res. 2003;53:580–8. doi: 10.1203/01.PDR.0000057206.14698.47. [DOI] [PubMed] [Google Scholar]
- 15.Pitson D, China N, Knijn S, van Herwaaden M, Stradling J. Changes in pulse transit time and pulse rate as markers of arousal from sleep in normal subjects. Clin Sci (Lond) 1994;87:269–73. doi: 10.1042/cs0870269. [DOI] [PubMed] [Google Scholar]
- 16.Pagani J, Villa MP, Calcagnini G, et al. Pulse transit time as a measure of inspiratory effort in children. Chest. 2003;124:1487–93. doi: 10.1378/chest.124.4.1487. [DOI] [PubMed] [Google Scholar]
- 17.Kato T, Katase T, Yamashita S, et al. Responsiveness of jaw motor activation to arousals during sleep in patients with obstructive sleep apnea syndrome. J Clin Sleep Med. 2013;9:759–65. doi: 10.5664/jcsm.2914. [DOI] [PMC free article] [PubMed] [Google Scholar]
- 18.Smith RP, Argod J, Pépin JL, Lévy PA. Pulse transit time: an appraisal of potential clinical applications. Thorax. 1999;54:452–7. doi: 10.1136/thx.54.5.452. [DOI] [PMC free article] [PubMed] [Google Scholar]
- 19.Senny F, Destiné J, Poirrier R. Mid jaw movements analysis for the scoring of sleep apneas and hypopneas. IEEE Trans Biomed Eng. 2008;55:87–95. doi: 10.1109/TBME.2007.899351. [DOI] [PubMed] [Google Scholar]
- 20.Senny F, Maury G, Cambron L, Leroux A, Destiné J, Poirrier R. Mandible behavior in obstructive sleep apnea patients under cpap treatment. Open Sleep J. 2012;5:1–5. [Google Scholar]
- 21.Maury G, Cambron L, Jamart J, Marchand E, Senny F, Poirrier R. Added value of a mandible movement automated analysis in the screening of obstructive sleep apnea. J Sleep Res. 2013;22:96–103. doi: 10.1111/j.1365-2869.2012.01035.x. [DOI] [PubMed] [Google Scholar]
- 22.Chu CHH, Delp EJ. Impulsive noise suppression and background normalization of electrocardiogram signals using morphological operators. IEEE Trans Biomed Eng. 1989;36:262–73. doi: 10.1109/10.16474. [DOI] [PubMed] [Google Scholar]
- 23.tR Core Team (2012) Vienna, Austria: R Foundation for Statistical Computing; R: A language and environment for statistical computing. URL http://www.R-project.org/ [Google Scholar]
- 24.Berry RB, Budhiraja R, Gottlieb DJ, et al. Rules for scoring respiratory events in sleep: update of the 2007 AASM Manual for the Scoring of Sleep and Associated Events. Deliberations of the Sleep Apnea Definitions Task Force of the American Academy of Sleep Medicine. J Clin Sleep Med. 2012;8:597–619. doi: 10.5664/jcsm.2172. [DOI] [PMC free article] [PubMed] [Google Scholar]
- 25.Martinot JB, Denison SJ, Senny FH, Robillard TA, Khatwa U, Guenard H. Mandibular movements and respiratory efforts against upper airway obstruction during sleep of a pre-school child. Open Sleep J. 2014;7:1–5. [Google Scholar]
- 26.Huang J, Pinto SJ, Yuan H, et al. Upper airway collapsibility and genioglossus activity in adolescents during sleep. Sleep. 2012;35:1345–52. doi: 10.5665/sleep.2110. [DOI] [PMC free article] [PubMed] [Google Scholar]
- 27.Carrera HL, McDonough JM, Gallagher PR, et al. Upper airway collapsibility during wakefulness in children with sleep disordered breathing, as determined by the negative expiratory pressure technique. Sleep. 2011;34:717–24. doi: 10.5665/SLEEP.1034. [DOI] [PMC free article] [PubMed] [Google Scholar]
- 28.Cheliout-Heraut F, Senny F, Djouadi F, Ouayoun M, Bour F. Obstructive sleep apnoea syndrome: comparison between polysomnography and portable sleep monitoring based on jaw recordings. Neurophysiol Clin. 2011;41:191–8. doi: 10.1016/j.neucli.2011.09.001. [DOI] [PubMed] [Google Scholar]
- 29.Scholle S, Wiater A, Scholle HC. Normative values of polysomnographic parameters in childhood and adolescence: arousal events. Sleep Med. 2012;13:243–51. doi: 10.1016/j.sleep.2011.07.022. [DOI] [PubMed] [Google Scholar]
- 30.Marcus CL, Brooks LJ, Draper KA, et al. Diagnosis and management of childhood obstructive sleep apnea syndrome. Pediatrics. 2012;130:e714–55. doi: 10.1542/peds.2012-1672. [DOI] [PubMed] [Google Scholar]
- 31.Tsuda H, Lowe AA, Chen H, Fleetham JA, Ayas NT, Almeida FR. The relationship between mouth opening and sleep stage-related sleep disordered breathing. J Clin Sleep Med. 2011;7:181–6. [PMC free article] [PubMed] [Google Scholar]
- 32.Foo JY, Wilson SJ, Bradley AP, Williams GR, Harris MA, Cooper DM. Use of pulse transit time to distinguish respiratory events from tidal breathing in sleeping children. Chest. 2005;128:3013–9. doi: 10.1378/chest.128.4.3013. [DOI] [PubMed] [Google Scholar]
- 33.Wiegand L, Zwillich CW, Wiegand D, White DP. Changes in upper airway muscle activation and ventilation during phasic REM sleep in normal men. J Appl Physiol. 1991;71:488–97. doi: 10.1152/jappl.1991.71.2.488. [DOI] [PubMed] [Google Scholar]
Associated Data
This section collects any data citations, data availability statements, or supplementary materials included in this article.
Supplementary Materials
1, 2, 3 are obstructed breaths. 4 is a breath on a cortical arousal. From 4 to 5, a central apnea. 5, 6 are obstructed breaths. SAO2, arterial oxyhemoglobin saturation; VTH and VAB; thoracic and abdominal inductance belts; NAF2P and NAF1, nasal pressure transducer and oronasal thermal flow sensor; MM, mandibular movements; PTT, pulse transit time; PHODB, microphone sound.
The opening and closing operators are applied first (upper graph). The difference between the operators is then smoothed to get the peak-to-peak amplitude of mandibular movements (middle graph). Finally, the MML periods (lower graph) are delimited outside MMS by using wavelet transform if the peak-to-peak displacement is greater than a predetermined threshold for ≥ 5 seconds.
The box height is the interquartile range (25%–75%); the solid line in each box corresponds to the median; the whiskers represent the 5 and 95% percentiles of the PTT (in ms). *The p value indicates the statistical difference between OAH and CAH events during the last ten seconds of apnea-hypopnea periods. The horizontal dotted line shows a threshold of 15 ms for the change in PTT. PTT, pulse transit time; AH, apneahypopnea; OAH, obstructive sleep apnea-hypopnea; CAH, central sleep apnea-hypopnea.
The first part of the fragment shows an unchanged mandibular position. By contrast, when flow limitations occurred—as illustrated by changes in nasal pressure, in synchrony with belt signal and microphone sound—the peak-to-peak mandibular movement increased above 0.3 mm as well as the inspiratory PPT until microarousal occurred. SaO2, arterial oxyhemoglobin saturation; VTH and VAB, thoracic and abdominal inductance belts; NAF2P and NAF1, nasal pressure transducer and oronasal thermal flow sensor; MM, mandibular movements; PTT, pulse transit time; Phono, microphone sound. A cortical arousal is enclosed into the small brown symbols. On the right is a tracing during a quiescent period of normal respiration and little mandibular movement.


