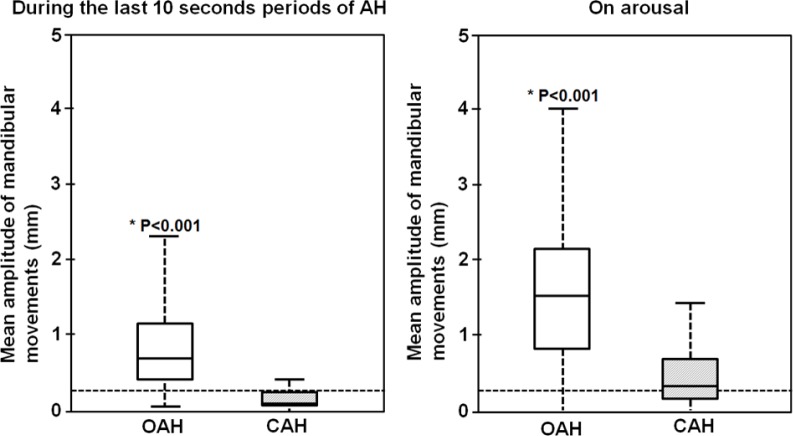
Figure 4. Box and whisker plots of the mean envelop of mandibular movements during the last 10 seconds periods of AH and on the subsequent arousals from 214 randomly selected obstructive and 214 identified central apneic events.
The horizontal dotted lines show a threshold of 0.3 mm for the peak to peak mandibular movement's amplitude changes that defines a MML; the box height is the interquartile range (25%–75%); the solid line in each box corresponds to the median; the whiskers represent the 5 and 95% percentiles. *The p values indicate the statistical difference between OAH and CAH events during the last ten seconds of apnea-hypopnea periods and on arousal. OAH, obstructive sleep apnea-hypopnea; CAH, central sleep apnea-hypopnea; AH, apnea-hypopnea.

