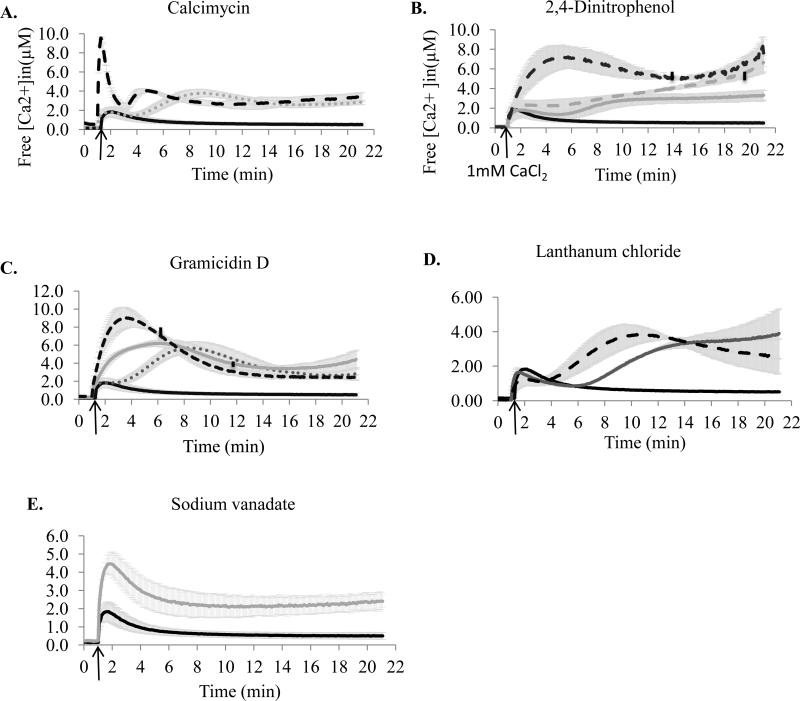
Figure 3.
Effect of inhibitors on free [Ca2+]in in P. aeruginosa PAO1. Cells grown in BMM media containing no added Ca2+ were treated with inhibitors for 10 min at room temperature. The basal level of luminescence was monitored for 1 min. 1 mM CaCl2 was added at the time indicated by the arrow, followed by luminescence measurements for 20 min. Changes in free [Ca2+]in were calculated as described in the Methods section. A. Calcimycin. Black, 0 mM; dashed black, 5 μM; small dotted grey, solvent control. B. Cells challenged with 2, 4 dinitrophenol. Black, 0mM; grey, 0.5 mM; dashed grey, 1 mM; dashed black, 2 mM. C. Gramicidin D. Black, 0 μg/ml; small dotted grey, 1 μg/ml; dashed black, 10 μg/ml; and grey, solvent control. Vertical lines on the plots indicate the points, at which the remaining available aequorin reached 10 % of the estimated total aequorin. D. LaCl3. Black, 0 μM; grey, 300 μM, and dashed black, 600 μM. E. Vanadate (2 mM, pH 7.5). The data were averaged from at least three independent experiments.

