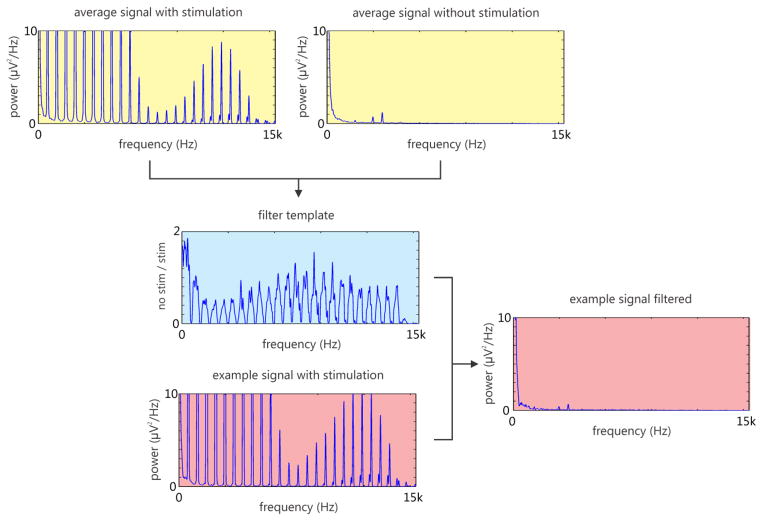
Figure 8.
Example of spectral filter generation from one channel (5 second interval; Channel 16; recording 20130403). The averaged power spectrum for stimulation (yellow; top left) and non-stimulation time bins (yellow; top right) is used to generate a filter template (blue; center). This filter is then used to remove artifacts in future instances (red; bottom left), which leads to a cleaned signal (red; right). Note that the three distinct peaks at 2400, 3000 and 3600 Hz in the averaged non-stimulation spectrum (yellow; top right) and filtered signal (red; right) are artifacts from the motion tracking system which are present continuously and therefore are not filtered out.

