Figure 9.

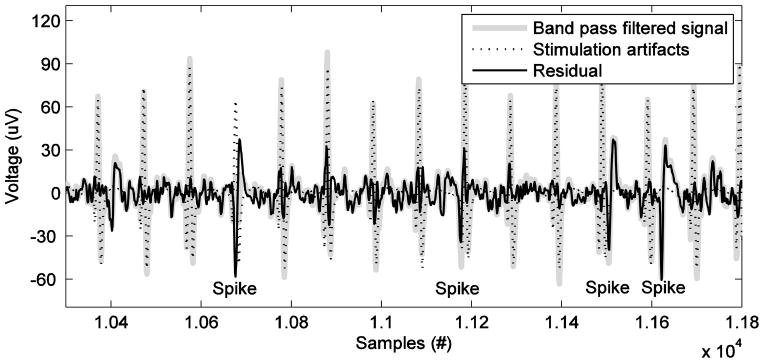
Time series of data before stimulation artifact rejection (gray) and after stimulation artifact rejection (black). The template of stimulation artifact applied is illustrated by dotted line.

Time series of data before stimulation artifact rejection (gray) and after stimulation artifact rejection (black). The template of stimulation artifact applied is illustrated by dotted line.