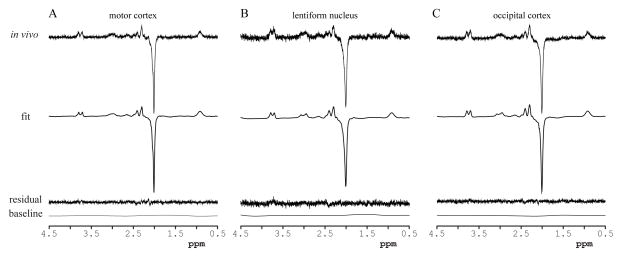
Figure 3. LCModel analysis.
LCModel analysis of representative spectra obtained in: (a) the motor cortex, (b) the lentiform nucleus, and (c) the occipital cortex. In vivo data, LCModel fits, residuals and baselines. A close match between the LCModel fits and the in vivo spectra was achieved as evidenced by the noise-dominated fit residuals and flat baselines.

