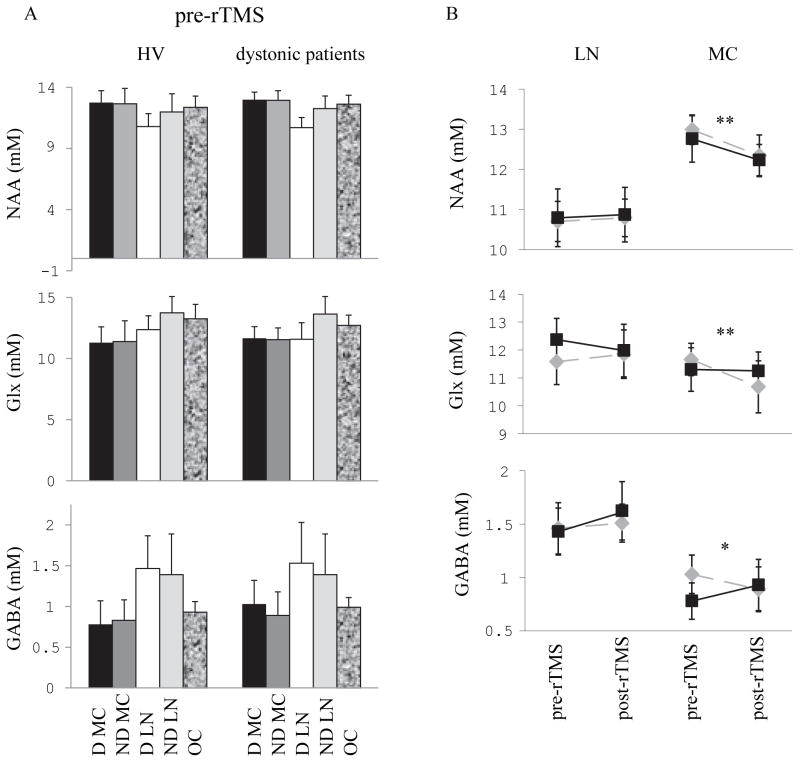
Figure 4. Concentrations of NAA, Glx and GABA measured by MRS at baseline and after rTMS to the dominant motor cortex.
(A) Bars represent the average absolute concentrations of brain metabolites quantified using LCModel and SD. Baseline concentrations of NAA (upper panel), Glx (middle panel) and GABA (lower panel) in motor cortices on the dominant (black bars) and non-dominant (dark grey bars) sides, lentiform nuclei on the dominant side (white bars) and non-dominant side (light grey bars) and occipital region (shaded bars) in healthy volunteers (left) and dystonic patients (right). (B): Average concentrations of NAA (upper panel), Glx (middle panel) and GABA (lower panel) in the dominant motor cortex (right) and in the lentiform nucleus (Lleft) are plotted at baseline and after 5 Hz rTMS to the dominant motor cortex in healthy subjects (black squares) and dystonic patients (grey diamonds). After rTMS, NAA decreased in both groups in motor cortex, GABA decreased in the patient group while it increased in the healthy volunteers group, and Glx was not modified in the healthy volunteers group while it decreased in the patient group.
Statistical significance is indicated by the stars: * p 0.05, ** 0.01 > p > 0 .001
Abbreviations: D: dominant, LN: lentiform nucleus, MC: motor cortex, ND: non-dominant

