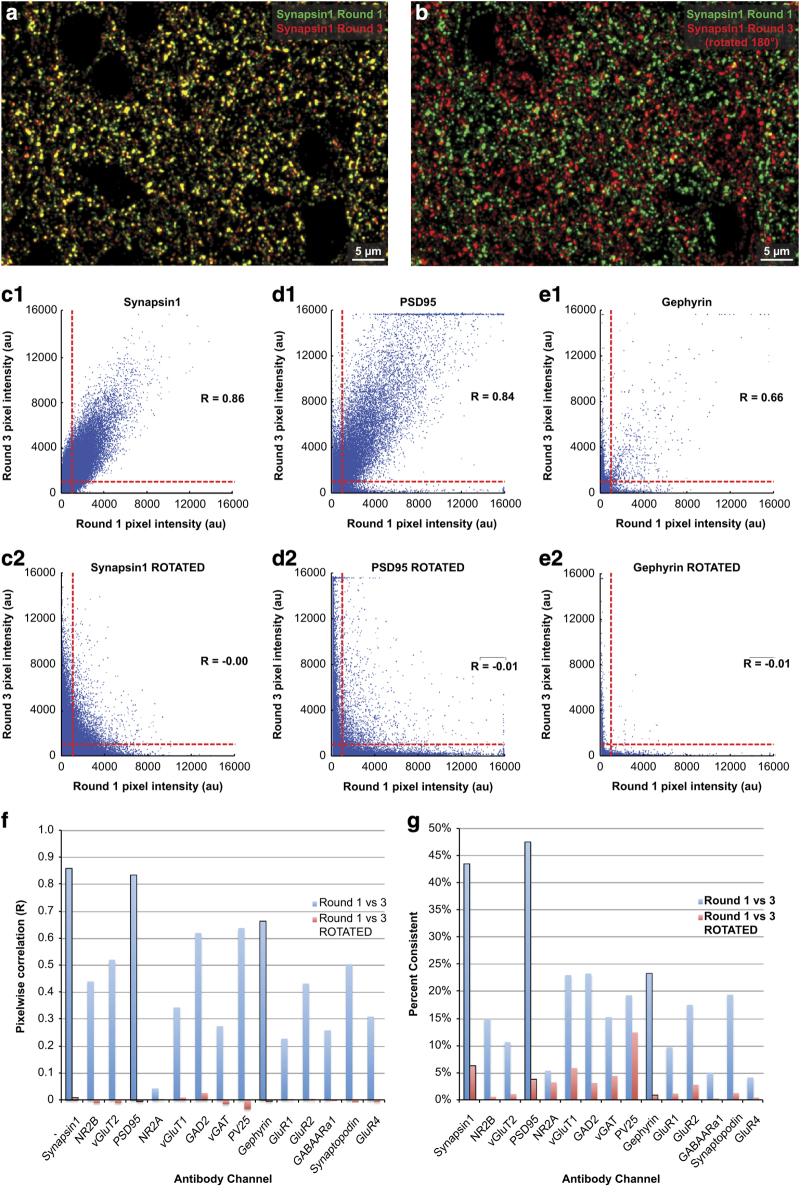
Figure 4. Evaluation of stain robustness across imaging sessions.
(a) False-color composite image comparing the first stain of a subregion of ribbon Ex1-R02A with an antibody against Synapsin1 protein (green) with the third sequential stain of the same region (red). Areas of overlap (yellow) represent consistent patterns of staining despite intervening rounds of stripping and restaining. (b) Here the image of the third round of staining has been rotated 180° to illustrate that the chance occurrence of overlapping staining is quite low, despite the high stain density in the two images. (c1) Synapsin1 immunofluorescence intensity at individual pixels compared between rounds 1 and 3. The R value represents Pearson’s correlation coefficient between the two images. An approximate threshold between foreground and background pixels (set at 1,000 a.u.) in each image is illustrated by horizontal and vertical red dashed lines. (c2) The same analysis with the image of round 3 rotated 180° to serve as a control for random colocalizations. (d,e) The same analyses for PSD95 and Gephyrin staining. (f) Comparison of correlation coeffients (R) for images of the first and third round of staining for 15 different antibodies. (g) For the same set of antibody stains, comparison of the ‘percent consistency’: the percent of pixels that were bright (above threshold) in either imaging session which were also bright in the other imaging session. See Table 10 for a full list of these values.

