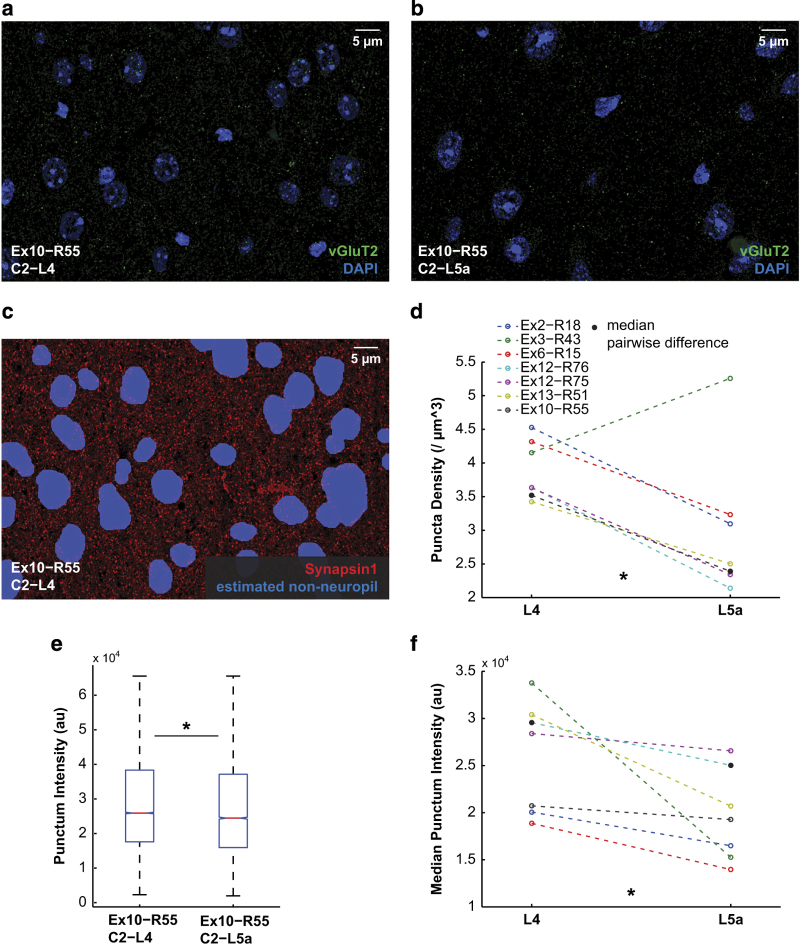
Figure 6. Quantification of vGluT2 staining in L4 and L5a.
(a) Maximum intensity projection of the C2-L4 ROI of ribbon Ex10-R55 stained for vGluT2 (green) and DAPI (blue). (b) The same for the C2-L5a ROI. (c) Maximum intensity projection of the C2-L4 ROI of ribbon Ex10-R55 stained for Synapsin1 (red). Neuropil volume in each ROI is estimated by using a geometric expansion of the Synapsin1 channel’s negative space (blue), as this antibody is strongly excluded from cell bodies. The adjusted volume is used to calculate neuropil puncta densities for comparison between ROIs. (d) Neuropil-normalized vGluT2 puncta densities across all Chessboard Dataset data volumes for L4 ROIs (left) and L5a ROIs (right), with spared and deprived ROIs within each layer averaged together. vGluT2 density in L5a was significantly less than in L4: median difference: 46.24%; P=0.0313 (Wilcoxon signed-rank nonparametric test for difference of group medians); n=7 ribbons. (e) vGluT2 punctum intensity distributions for ribbon Ex10-R55 ROI C2-L4 (median 25,923 a.u.; n=24,189 puncta) and C2-L5a (median 24,454 a.u.; n=14,888 puncta). Shown are median values (red horizontal line), comparison interval (notch in box plot), interquartile range (vertical box extent), and maximum and minimum values (whiskers). Population medians are significantly different: P=4.85*10−21 (Wilcoxon signed-rank nonparametric test for difference of group medians). (f) Median punctum intensity across all ribbons for L4 ROIs (left) and L5a ROIs (right), with spared and deprived ROIS within each layer averaged together. Median vGluT2 punctum total intensity in L5a was significantly less than in L4: median difference: 21.56%; P=0.0156 (Wilcoxon signed-rank nonparametric test for difference of group medians); n=7 ribbons.

