Figure 7.

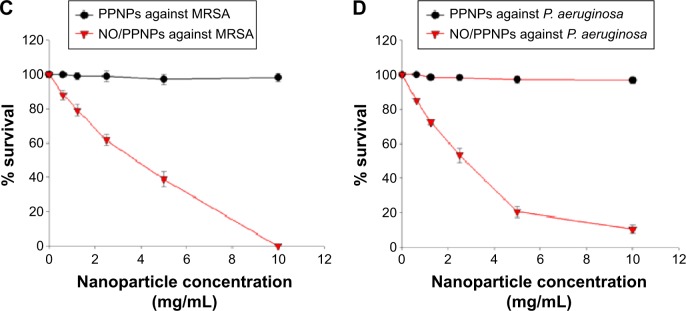
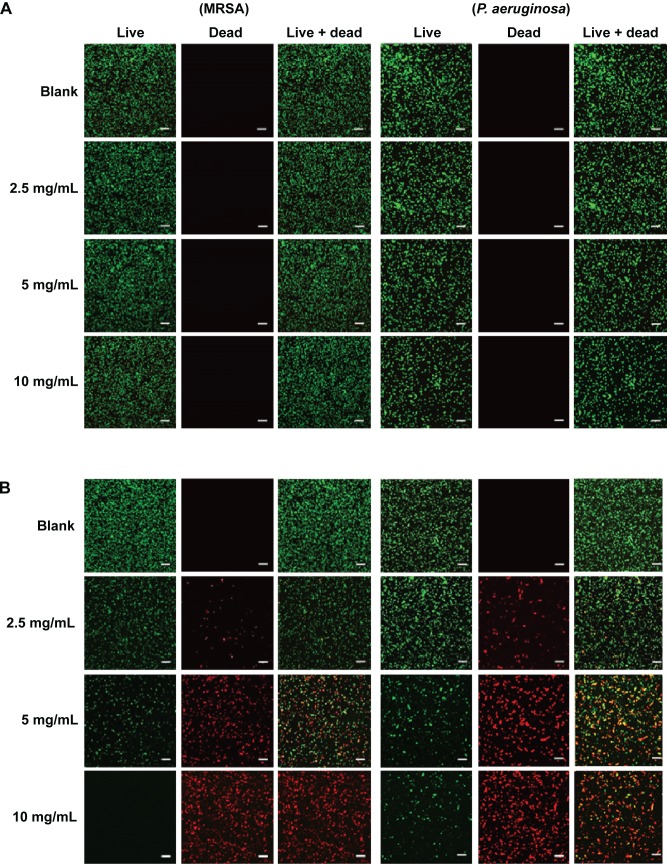
Confocal microscopy images and the percent (%) survival of MRSA (left panel) and Pseudomonas aeruginosa (right panel) after 24 hours of treatment with nanoparticles at different concentrations.
Notes: (A) PPNPs, (B) NO/PPNPs, (C) percent (%) survival against MRSA and (D) percent (%) survival against P. aeruginosa. Syto-9 fluorescence (green) indicates intact membrane of healthy bacteria, PI fluorescence (red) indicates membrane destruction and cell death. Bacterial survival at each point is presented as a percentage relative to the control group (buffer alone). Data shown are mean ± standard deviation; n=3. (A and B) Bars represent 20 μm.
Abbreviations: PLGA, poly(lactic-co-glycolic acid); PEI, polyethylenimine; PPNPs, PLGA-PEI nanoparticles; NO/PPNPs, NO-releasing PLGA-PEI nanoparticles; MRSA, methicillin-resistant Staphylococcus aureus; PI, propidium iodide; NO, nitric oxide.

