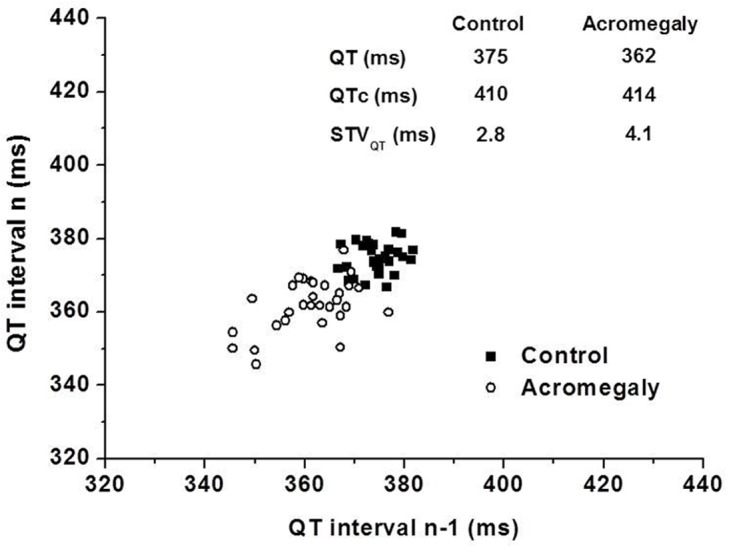
Fig 1. Representative Poincaré plots of a control individual and a patient with acromegaly.

Note the larger area covered by data points obtained in the acromegalic patient illustrating increased short-term variability of the QT interval. Abbreviations: QTc, corrected QT interval by Bazett formula; STVQT, short-term variability of the QT interval.
