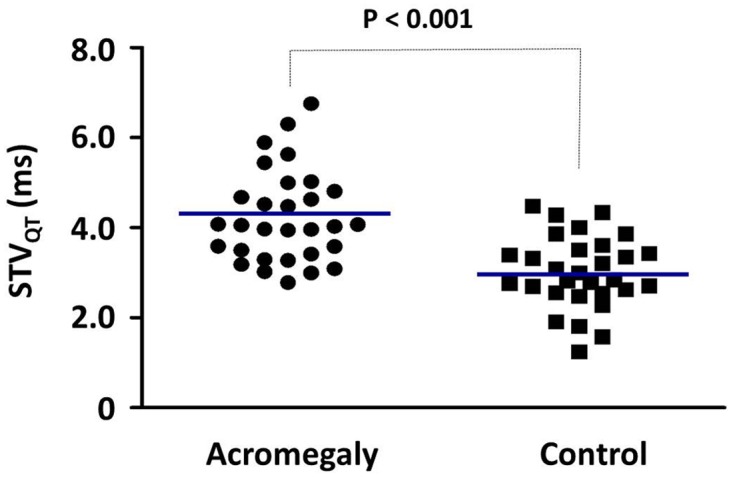
Fig 2. Short-term beat-to-beat temporal variability of the QT interval (STVQT) in acromegalic and matched control patients.

Individual values measured in n = 30 patients in each group are presented, the blue lines indicate mean values, P<0.001.

Individual values measured in n = 30 patients in each group are presented, the blue lines indicate mean values, P<0.001.