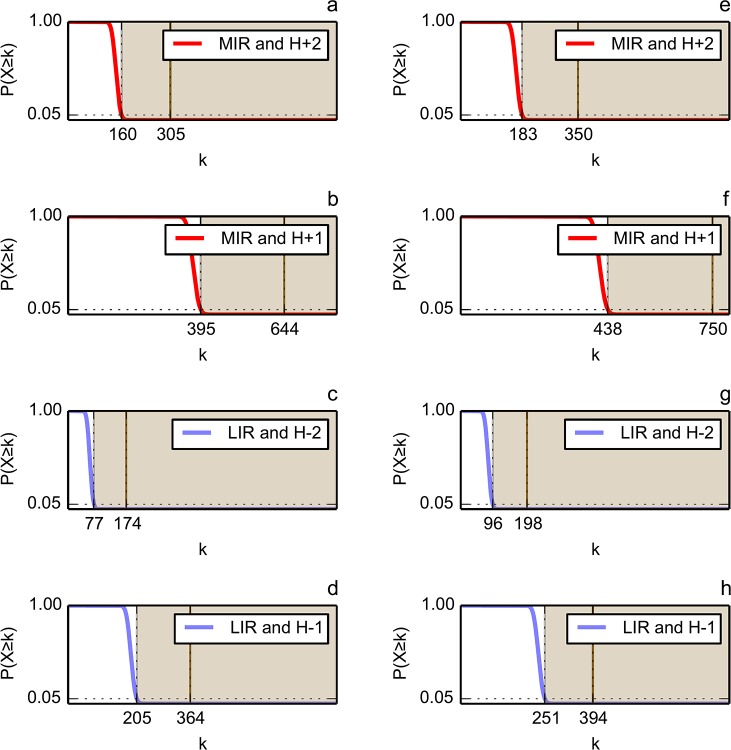
Fig 6. Probabilities of observing an IR/FOD intersection of size greater than or equal to k, derived from the parametric hypergeometric distributions, for the Ig (a-d) and Flav (e-h) folds.
The values of the parameters (K, N-K and n) of the hypergeometric distributions are given in Table 3. The probability decreases from 1 down to 0 while k increases. The dashed vertical line represents the 95% quantile, i.e. the theoretical value of k that corresponds to a p-value exactly equal to 0.05. It constitutes the lower limit of the significance area (grey shading), which covers the values of k that correspond to an IR/FOD intersection significantly different from random. The continuous vertical line represents the observed size of the IR/FOD intersection, i.e. the observed value of k. These values (95% quantile, observed intersection size) are given in Table 3.

