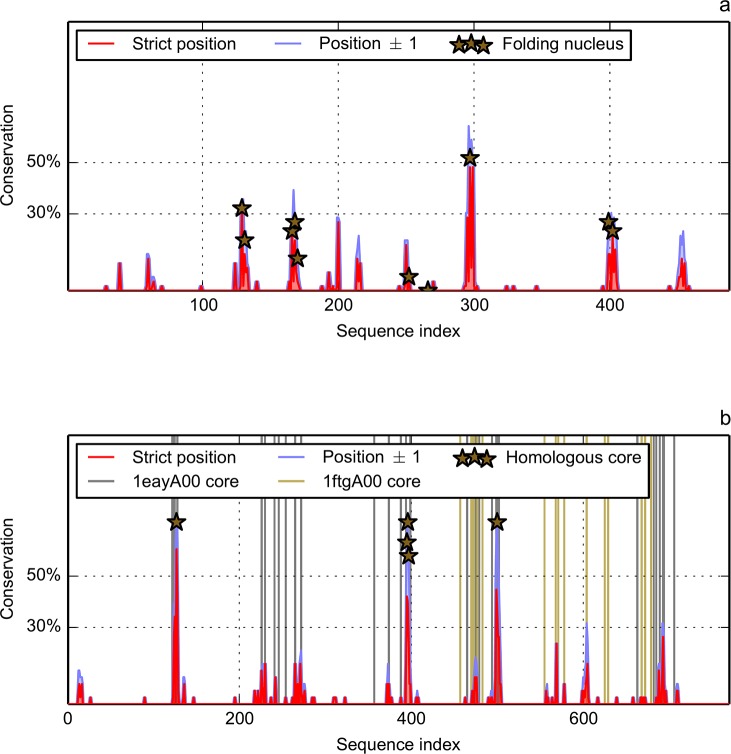
Fig 7. Position-related conservation of MIR and FOD (H+2) predictions in the multiple sequence alignment.
The X-axis represents the sequence positions in the multiple alignment, therefore it is much longer than a mean domain size to account for the numerous insertions/deletions. At a given position in the alignment, the conservation of predicted MIR and H+2 is expressed as a proportion of total number of sequences. Two windows are used: strict position (length 1) in red and position ±1 (length 3) in blue. a) Ig fold. Markers indicate positions experimentally determined as members of the folding nucleus in four CATH domains: 1tenA00, 1titA00, 1ttfA00 and 1k85A000. b) Flav fold. Vertical green (brown) lines represent the positions attributed to core of 1eayA00 (1ftgA00). Markers indicate positions in the alignment attributed to the core of both 1eayA00 and 1ftgA00.

