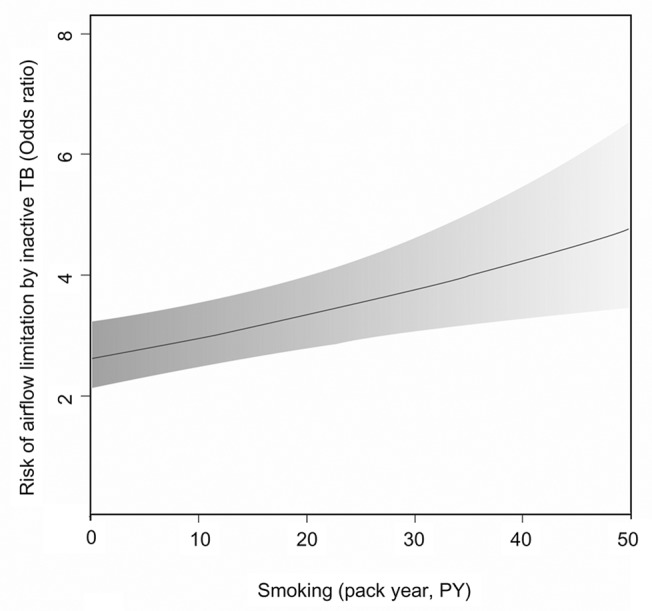
Fig 4. The impact of inactive TB on airflow limitation according to smoking history.

The gray region represents the 95% confidence interval of the odds ratios. PY = pack-years.

The gray region represents the 95% confidence interval of the odds ratios. PY = pack-years.