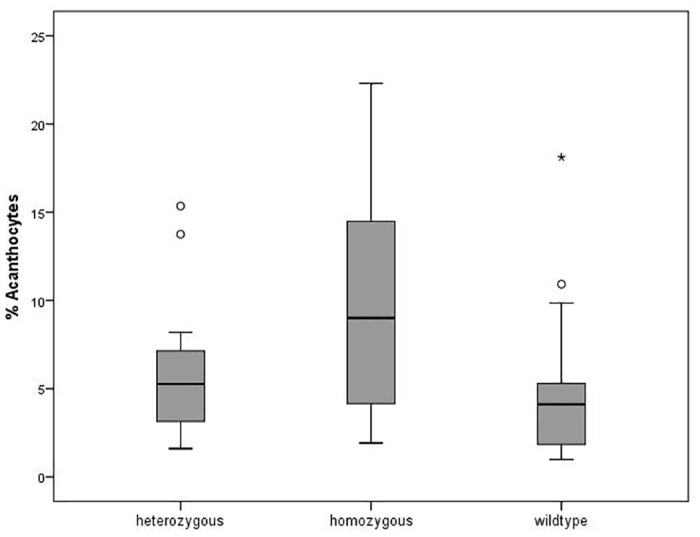
Fig 2. Distribution of acanthocytosis in the patient and control samples.

The distribution of the amount of acanthocytes (in % of total cells) in the samples of donors that are heterozygous (n = 36), homozygous (n = 23) and wild-type (n = 22) with respect to the c.680 A>G mutation in the PANK2 gene is shown in a Box-Whiskers blot. The circles are outliers, and the asterisk is a far outlier.
