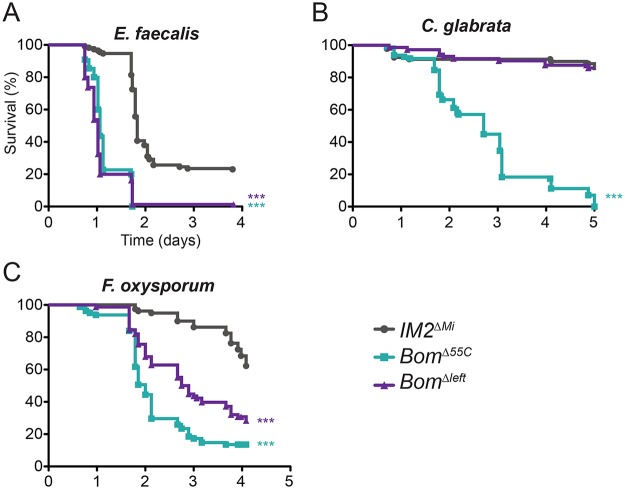
Fig 5. Loss of a subset of the 55C Bom genes has an intermediate effect on survival.
Graphs indicate survival at indicated intervals post-infection with (A) E. faecalis, (B) C. glabrata, and (C) F. oxysporum. Each curve represents the pooled results of at least three independent experiments involving 20 or more flies per genotype. Survival curves were compared using the Gehan-Breslow-Wilcoxon test. Significance is relative to IM2 ΔMi and adjusted for multiple comparisons (*** p<0.0003, n.s. = not significant, p>0.0167).

