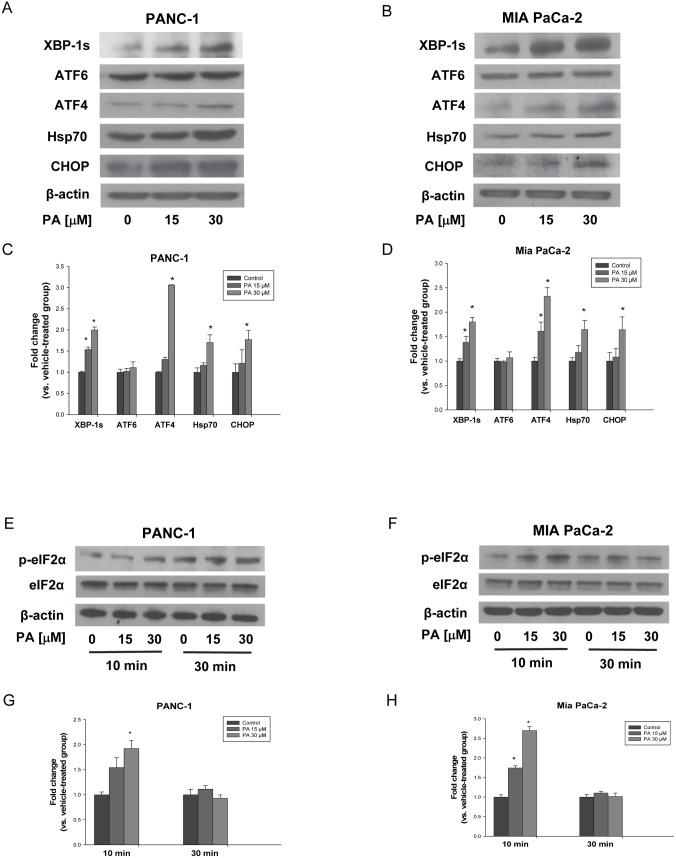
Fig 2. PA induces expression of ER stress response proteins.
(A) PANC-1 and (B) MIA PaCa-2 cells were treated with PA (0–30 μM) for 24 h, respectively. Whole protein extracts isolated from cells were prepared and western blot analysis with anti-XBP-1s, anti-ATF6, anti-ATF4, anti-Hsp70 and anti-CHOP antibodies were performed as described in Materials and methods. (E) PANC-1 and (F) MIA PaCa-2 cells were treated with PA (0–30 μM) for 10 min and 30 min, respectively. Whole protein extracts isolated from cells were prepared and western blot analysis with anti-phospho-eIF2α and anti-eIF2α antibodies were performed as described in Materials and methods. β-actin was used as loading control. Representative blots from three experiments were shown and quantitative data composed of all the experiments in C), G) PANC-1 and D), H) MIA PaCa-2 cells with statistical analysis were below the representative blot image. *P<0.050 was considered to be significant when compared to control (n = 3) by Student t-test. The graphical data represent mean +/- SD.

