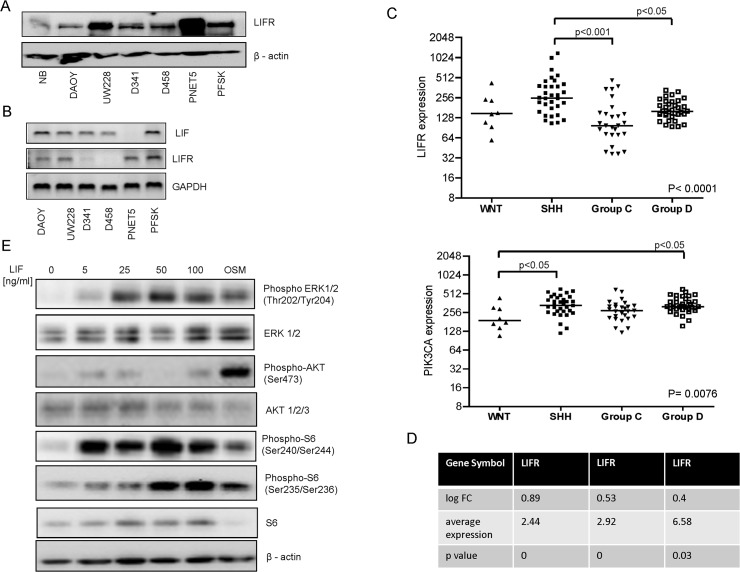
Fig 5. Expression of LIFRα and LIF in medulloblastoma cell lines and primary brain tumors.
(a) LIFRα protein levels in medulloblastoma cell lines and normal brain (NB) tissue were evaluated by Western blot and compared with β-actin as the loading control. (b) LIF and LIFR expression in medulloblastoma cell lines was analyzed by semi quantitative RT-PCR. (c) Expression of PIK3CA and LIFR derived from the transcriptomic analysis of primary medulloblastoma, grouped according to molecular disease variants. Data from Northcott et al [32] are shown. Gene expression levels were compared using the Kruskal-Wallis test and the p-value is shown at the bottom right of the illustration. As this global test was significant, Dunn's post hoc tests were used to compare the groups. P-values < 0,05, as determined by Dunn's post hoc tests, are indicated in order to illustrate the differences. (d) Analysis of cDNA microarray data performed on PTCH1 +/-; TP53 +/- or PTCH1 +/- ; TP53 +/+ mice. The table represents a summary of fold change (logFC), average expression values (AveExpr), p values obtained by comparison of the two murine strains from Data set GEO accession number GSE37316). (e) Cell lysates of DAOY cells stimulated with or not with 5, 10, 25, 50 and 100 ng/ml of LIF for 10 min were analyzed for expression and phosphorylation of AKT and ERK pathway downstream targets. Treatment of 10 ng/ml of OSM for 10 min was used as a positive control.

