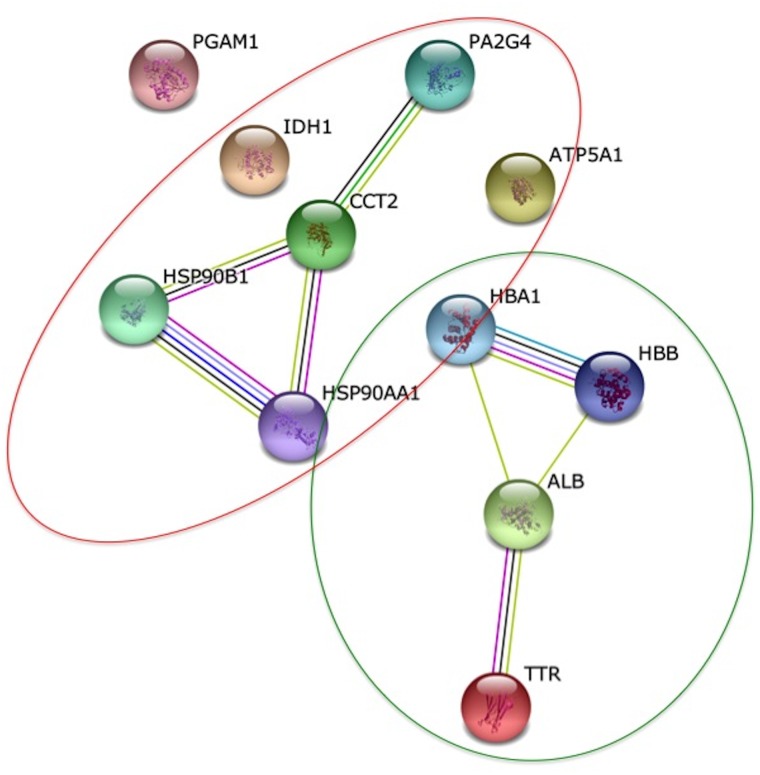
Fig 4. Protein interaction network of altered proteins at Day 14.
In the network generated by STRING v.9.1, each node represents a protein and each edge represents an interaction, coloured by evidence type (see STRING website for colour legend). The original graphic output was modified including circles to group the proteins according to their regulation. A green line means upregulation and a red line downregulation.

