
Fig 3. Confocal images of CACNA1S following stimulations with Rv2463 and M. tb on macrophages.
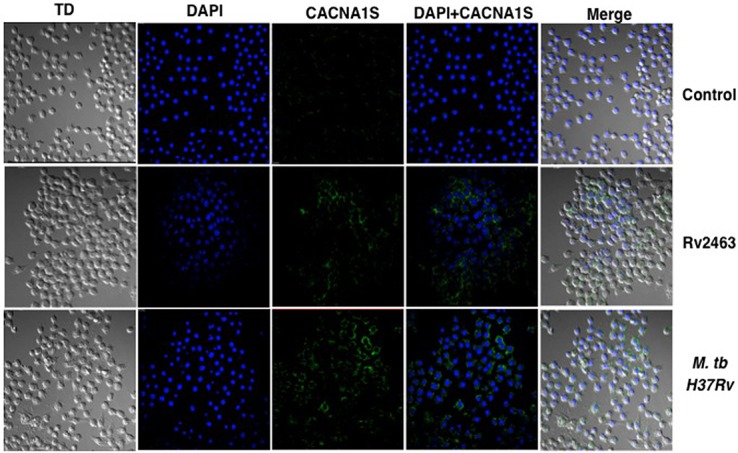
J774 cells were stimulated with 25 μg/ml Rv2463 or 2 MOI M. tb H37Rv for 48h. CACNA1S expression was monitored by confocal imaging (see Materials and Methods). Blue colour represents staining of nucleus with DAPI while green colour represents CACNA1S staining with streptavidin conjugated FITC bound to biotinylated antibody to CACNA1S. A representative image of 10 fields is shown. P<0.009 for unstimulated v/s 25 μg/ml of Rv2463; P<0.004 for uninfected v/s 2 MOI of M. tb H37Rv infected macrophages. Two-tailed Student’s t-test was employed for P values for 48h time point.