
Fig 7. Transcription factors CREB, SOX5 and GATA2 regulate Rv2463 and M. tb mediated CACNA1S expression on macrophages.
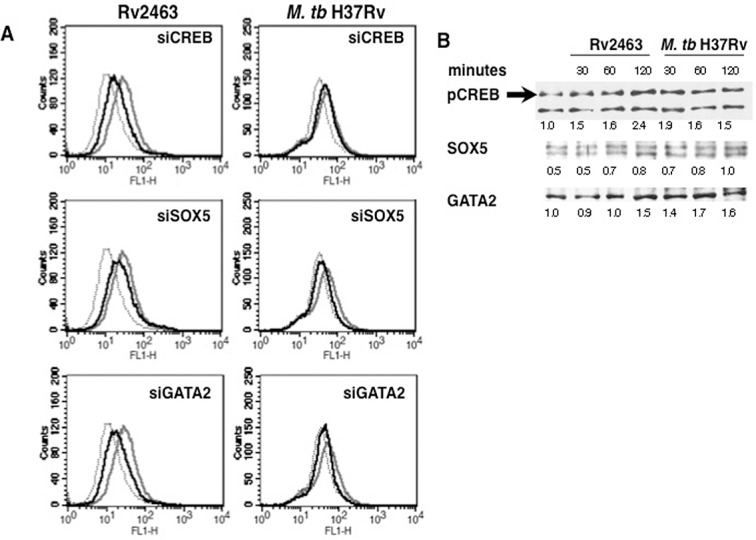
For Panel A, J774 cells were transfected with siRNAs against CREB or SOX5 or GATA2 for 36h followed by stimulations with 25 μg/ml Rv2463 or infection with 2 MOI of M. tb H37Rv for 48h. CACNA1S expression was monitored by flow cytometry. Grey lines represent cells transfected with control siRNAs followed by stimulations with Rv2463 or infection with M. tb. Bold lines represent cells transfected with specific siRNA to indicated molecules followed by stimulations with Rv2463 or infection with M. tb H37Rv. Dotted lines represent unstimulated cells transfected with control siRNAs. One of three independent experiments is shown. For Panel B, J774 cells were stimulated with 25 μg/ml Rv2463 or infection with 2 MOI of M. tb H37Rv for indicated times and nuclear extracts were western blotted for indicated molecules. Arrow indicates specific band. Numbers below the bands indicates relative intensities of the blots. One of two independent experiments is shown. For Panel A, P<0.035, control siRNA+Rv2463 v/s Creb+Rv2463; P<0.038 for control siRNA+Rv2463 v/s siSOX5+Rv2463; P<0.036 for control siRNA+Rv2463 v/s siGATA2+Rv2463. Two-tailed Student’s t-test was employed for P values. For Panel B, Creb phosphorylation; P<0.006, Unstimulated v/s Rv2463 stimulation 30 minutes; P<0.004, Unstimulated v/s Rv2463 stimulation 60 minutes; P<0.002, Unstimulated v/s Rv2463 stimulation 120 minutes; P<0.001, Unstimulated v/s M. tb infection 30 minutes P<0.003, Unstimulated v/s M. tb infection 60 minutes; P<0.004, Unstimulated v/s M. tb infection 120 minutes. Two-tailed Student’s t-test was employed for P values.