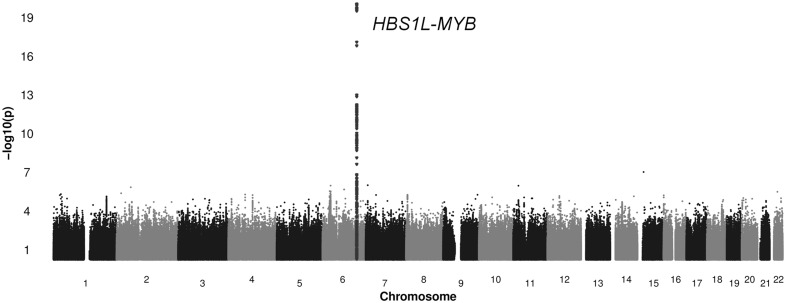
Fig 2. Association of serum erythropoietin with single-nucleotide polymorphisms (SNP).
The -10log(P-value) is displayed on the y-axis, a higher value corresponds to a stronger association. Chromosome location is displayed on the x-axis. Each dot represents an individual SNP, the dark grey dots are the SNPs located in locus 6q23.

