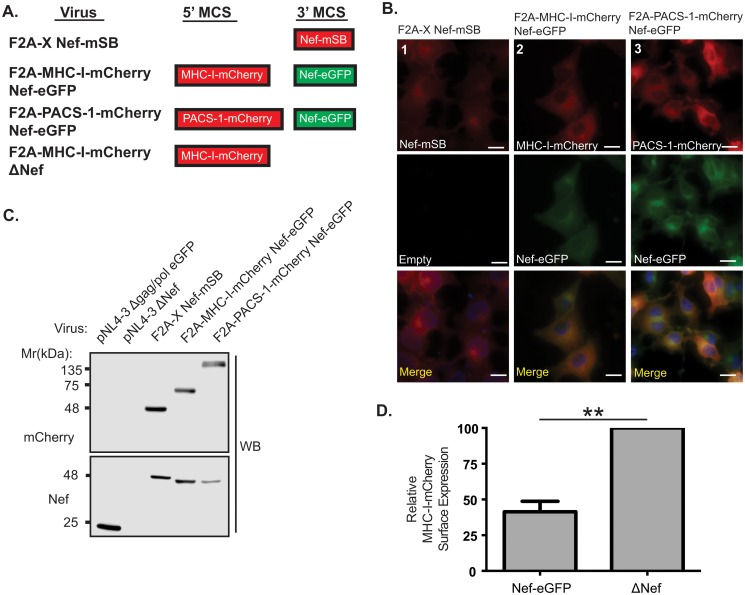
Fig 3. Fluorescence microscopy confirms expression of proteins from the 5’ and 3’ MCS.
Viruses were engineered to produce MHC-I-mCherry or PACS-1-mCherry from the 5’ MCS in combination with Nef-eGFP from the 3’ MCS. (A) Schematic representation of proteins produced from lentiviral expression system. (B) To detect the fluorescent fusion proteins, HeLa cells were infected and visualized 48 hours post infection by widefield fluorescence microscopy. Expression of the Nef-mSB fusion protein was confirmed (column 1), along with concurrent expression of MHC-I or PACS-1-mCherry fusions with Nef-eGFP (columns 2 and 3). Cell nuclei were stained using Hoescht nuclear stain (blue). Scale bars represent 15μm. (C) mCherry and Nef specific western blots were performed to confirm the expression of the fusion proteins. (D) Jurkat E6.1 T-cells were infected with pNL4-3 F2A-MHC-I-mCherry Nef-eGFP (Nef-eGFP) or pNL4-3 F2A-MHC-I-mCherry ΔNef (ΔNef). At 48 hours post infection, cells were surface stained for MHC-I-mCherry (BB7.2 antibody), fixed, permeabilized and stained for intracellular p24 (KC57-RD1 antibody). Columns represent relative MHC-I-mCherry surface expression calculated from the geometric mean fluorescent intensity (gMFI) of surface MHC-I-mCherry on infected cells and normalized to the cell surface MHC-I-mCherry levels of ΔNef-infected cells. Error bars were calculated from four independent repeats. (* indicates p-value < 0.01).

