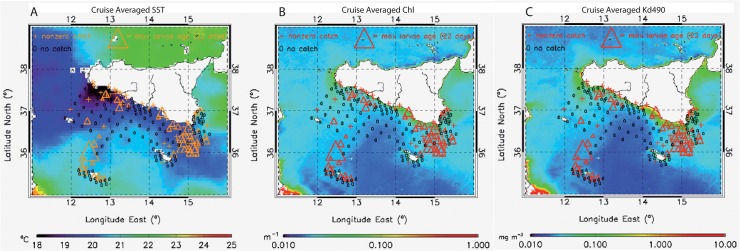
Fig 2. Cruise averaged satellite products and anchovy larvae distribution.

Ichthyoplanktonic sampling stations of the ANSIC 2004 survey. Triangles indicate larvae ages inferred from otoliths, ‘o’ indicates no catch, ‘+’ indicates stations with non-zero catch, where the otoliths were not measured. These stations are superimposed to cruise-averaged maps of satellite (A) SST, (B) Chl, and (C) Kd490. See also anchovy larvae concentrations in S2 Fig.
