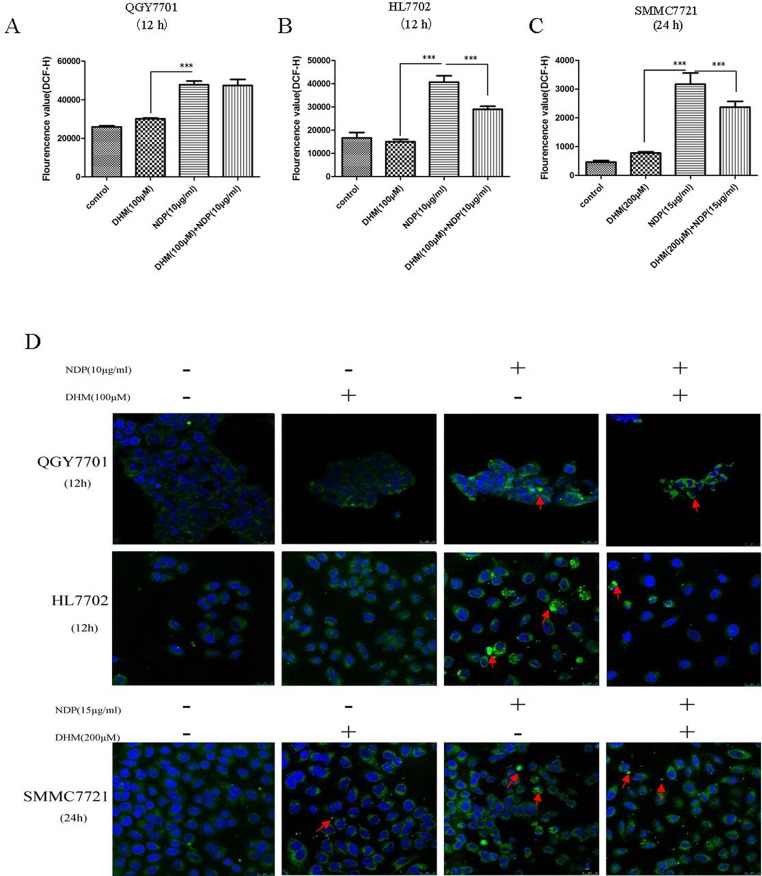
Fig 4. The alteration of ROS in normal liver cells and hepatoma cells.
(A,B,C) The level of ROS changes in QGY7701, HL7702 and SMMC7721 cells after treatment with DHM and NDP were detected using the DCFH assay. (B) The morphological changes in the mitochondria in QGY7701, HL7702 and SMMC7721 cells after treatment with the drug individually and in combination were detected using mito-tracker green. Each experiment was repeated at least three times.

