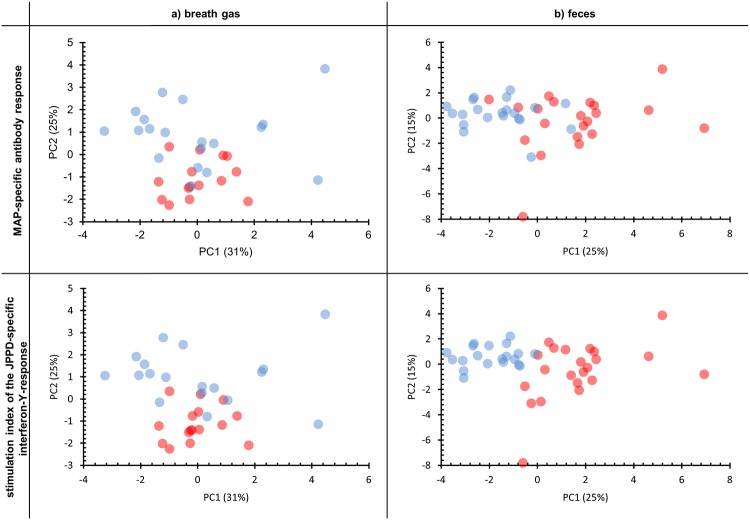
Fig 2. PCA-scatterplots of VOC patterns in breath gas (a) and headspace over feces (b) in relation to MAP-specific antibody levels and to the interferon-γ response.
Red dots represent S/P-ratios of the antibody-ELISA higher than 51 and stimulation-indices of the interferon-γ response higher than 1.157, respectively. The loading plot referring to the PCA results from breath gas is given in S1 Fig and the loading plot referring to the PCA analysis of results from feces is given in S2 Fig, respectively. Blue dots represent S/P-ratios of the antibody-ELISA lower than 51 and stimulation-indices of the interferon-γ response lower than 1.157, respectively.

