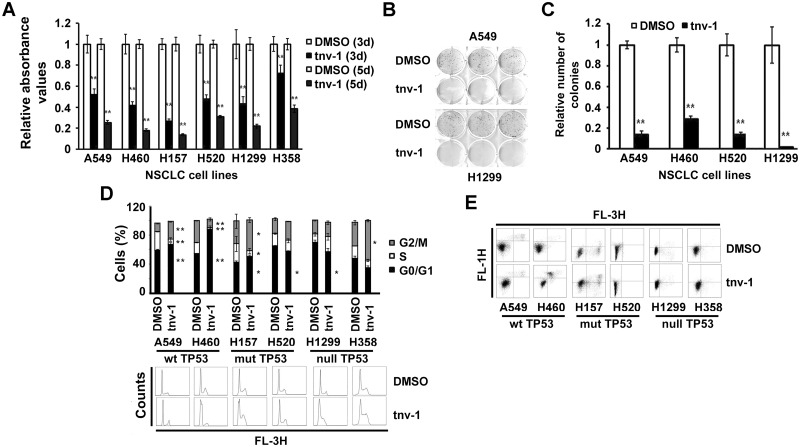
Fig 4. Treatment with tnv-1 decreases growth of NSCLC cell lines.
A, NSCLC cell lines were treated with 10 μM tnv-1. After three (3 d) and five (5 d) days the proliferation was measured by MTT assay. Relative proliferation values were obtained by dividing the absorbance values with those of the DMSO controls. Error bars represent standard deviation (SD). **, P < 0.01. B, Representative image of clonogenic assays (anchorage dependent growth). Cells were seeded and treated with tnv-1 (10 μM). After 10 days, colony formation was determined. C, Quantification of soft agar colony formation (anchorage independent growth) after tnv-1 treatment (10 μM) of NSCLC cell lines. Mean relative colony numbers and SD are shown. **, P < 0.01. D, Cell cycle distribution of NSCLC cells. Cells were treated with tnv-1 (10 μM) for 72 h, collected and analyzed by flow cytometry. E, Effect of tnv-1 (10 μM) on apoptosis. Cells were treated (48 h), collected and the cell death was assessed by Annexin V labeling. Error bars, SD.

