
Figure 2.
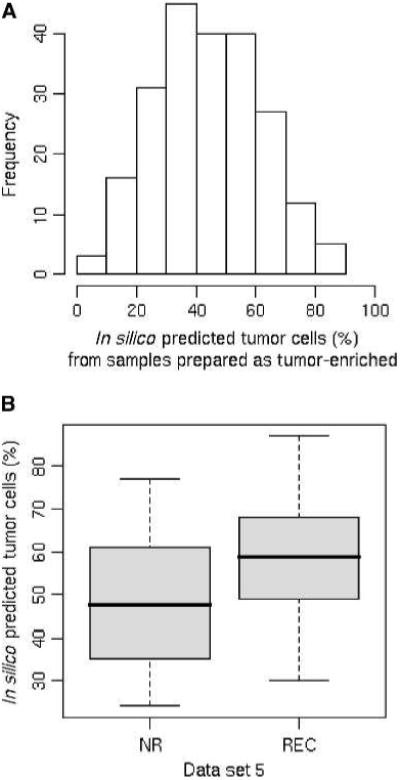
Tissue component predications on publicly available data sets. A, histogram of the in silico predicted tumor components of 219 arrays that were generated from samples prepared as tumor-enriched prostate cancer samples. X axis, in silico predicted tumor cell percentages. Y axis, frequency of samples. B, box plot shows the differences in tumor tissue components between the nonrecurrence and the recurrence groups of prostate cancer samples in data set 5. X axis, sample groups; NR, nonrecurrence group; REC, recurrence group. Y axis, tumor cell percentages.