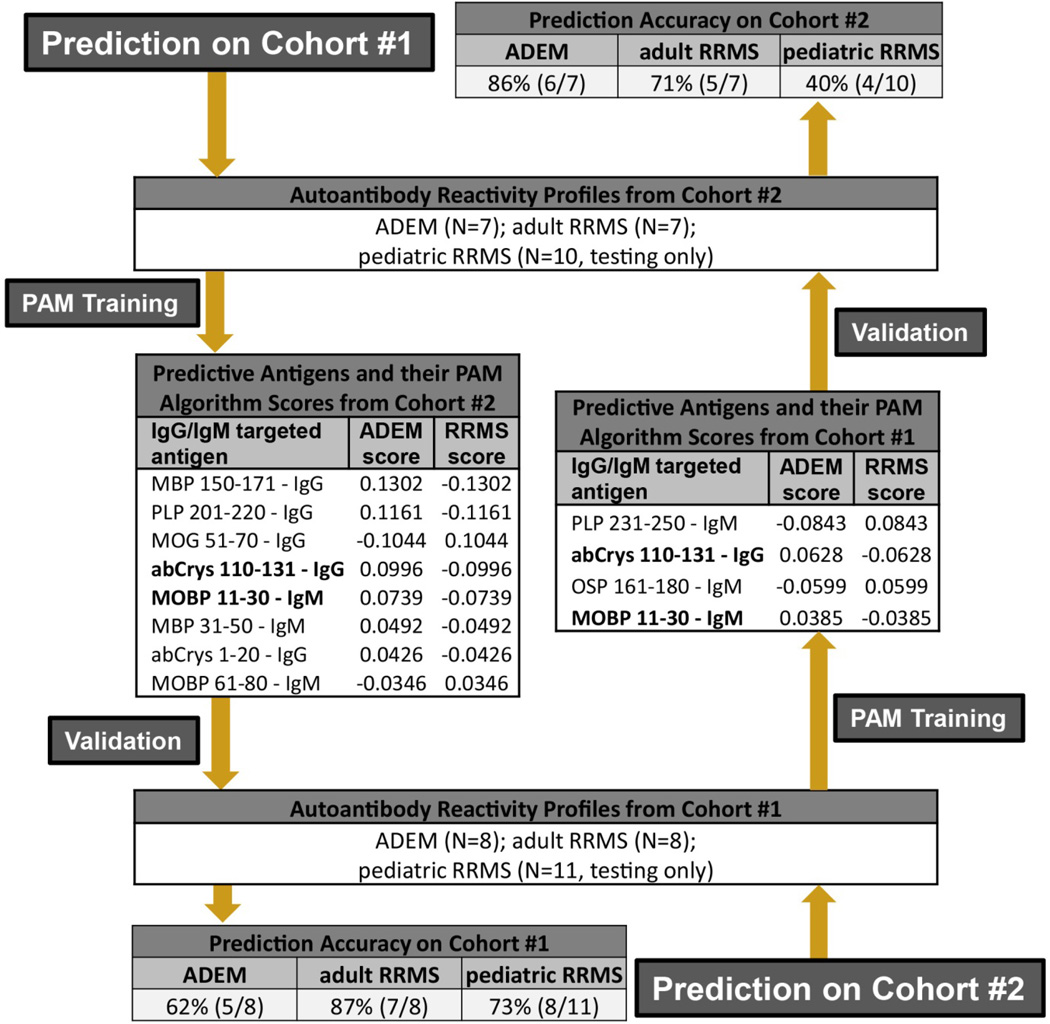
Figure 2. Performance of serum autoantibody profiles in the differential diagnosis of ADEM and MS.
We used PAM to generate and validate prediction algorithms based on autoantibody reactivity profiles. For prediction on Cohort 1 (starting top left), we generated an algorithm (antigens and scores as listed) by ‘training’ PAM using the reactivity profiles from Cohort 2. We validated this algorithm using the autoantibody reactivity profiles from Cohort 1. The prediction accuracy of the algorithm is listed at the bottom left. To further test the validity of our autoantibody prediction paradigm, we reversed the order of training and validation (starting bottom right) such that the training analysis was done using reactivity profiles from Cohort 1 and validated using serum samples from Cohort 2. Shown in bold are the IgG-targeted antigens that differentiated between ADEM and MS in both prediction trials. There were no overlapping patients in Cohorts 1 & 2. SN, sensitivity; SP, specificity; MOBP, myelin-associated oligodendrocyte basic protein; abCrys, alpha-B-crystallin; PLP, proteolipid protein; OSP, oligodendrocyte specific protein; MBP, myelin basic protein; CNPase, 2’,3’ cyclic nucleotide phosphodiesterase, MOG, myelin oligodendrocyte glycoprotein.

