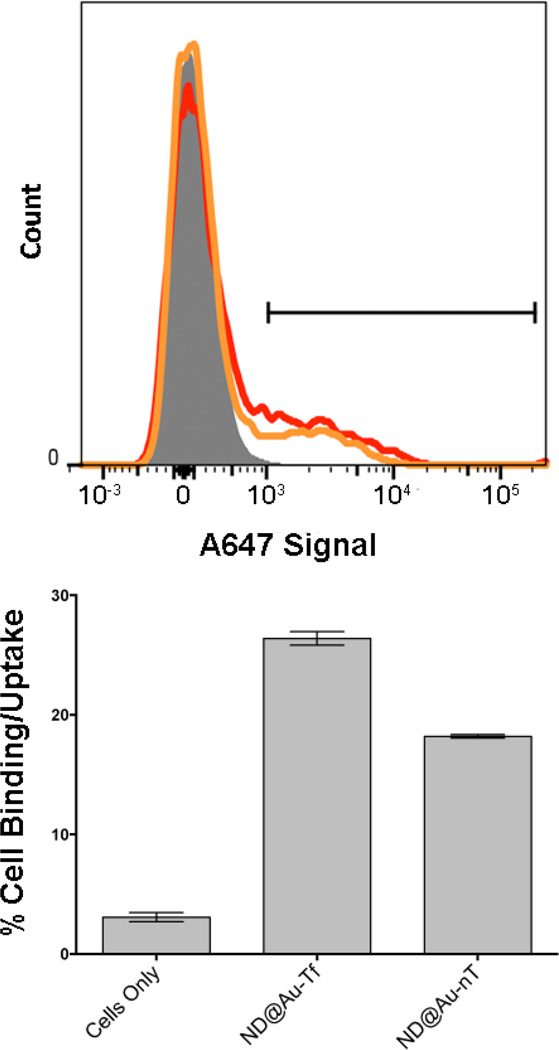
Figure 4.
SKBR3 cell interactions with particles determined by flow cytometry. Upper histogram: gray, cells only; red, ND@Au-Tf; orange, ND@Au-nT. Bottom graph: Statistical analysis showing percent cellular uptake (positive cells shown on histogram by gate) for each sample. Error bars indicate standard deviation. Experiments were conducted in triplicate, and 10,000 gated events were analyzed. Student’s t-test indicates significant differences comparing targeted ND@Au-Tf and non-targeted ND@Au-nT formulations (p < 0.05).

