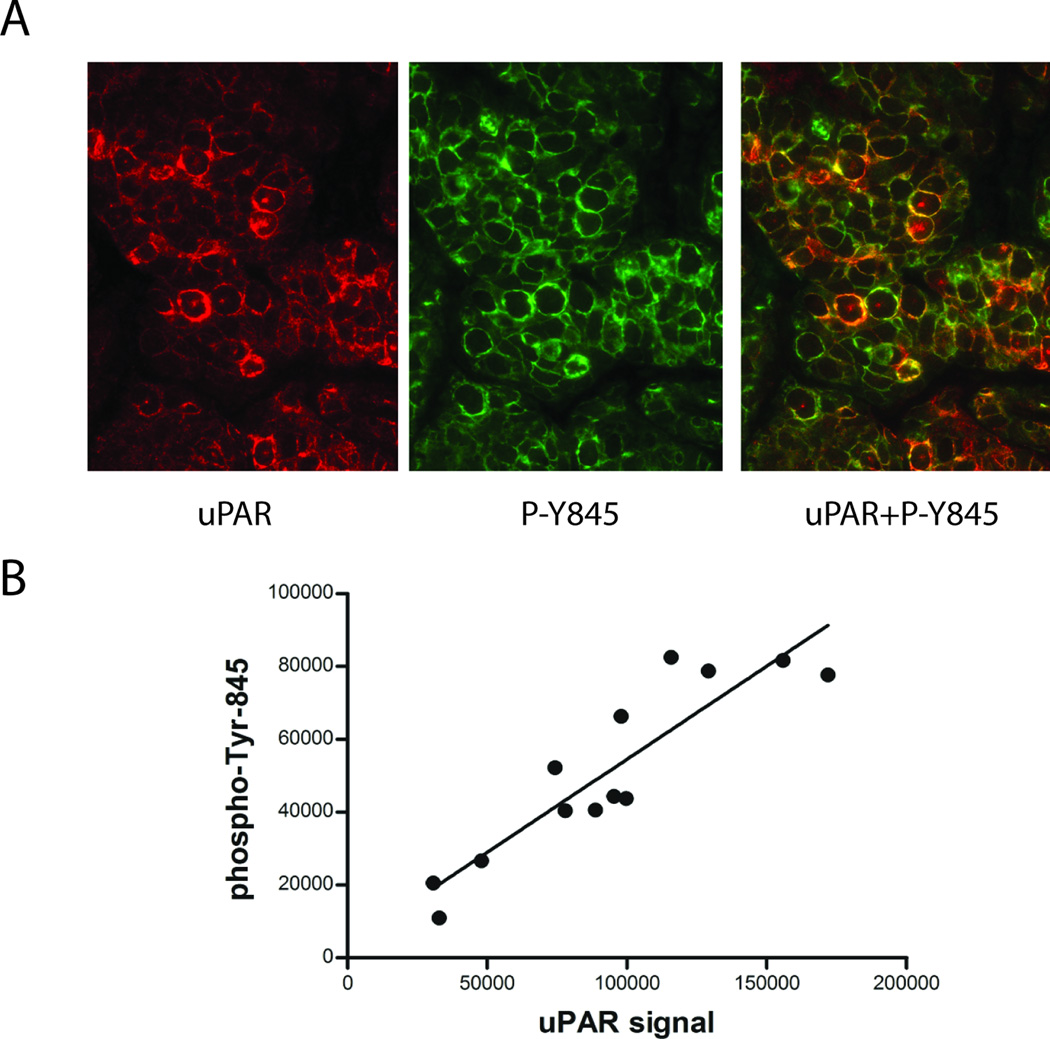
Figure 3.
uPAR and phospho-Tyr-845 vary concordantly in individual cells in human GBM tissue. (a) An EGFRvIII-expressing human GBM was propagated as a xenograft. Harvested tissue was subjected to quantum dot immunofluorescence microscopy using antibodies that detect human uPAR (red, left) and phospho-Tyr-845 (green, middle). The merged image (right), highlights co-localization of uPAR and phospho-Tyr-845 (yellow). (b) To quantify antigen signal intensity, multispectral imaging was performed followed by spectral intensity analysis. The signal intensity for uPAR-staining was plotted against that for phospho-Tyr-845-staining in randomly selected individual cells, revealing a tight correlation (R2=0.87).

