
Figure 2.
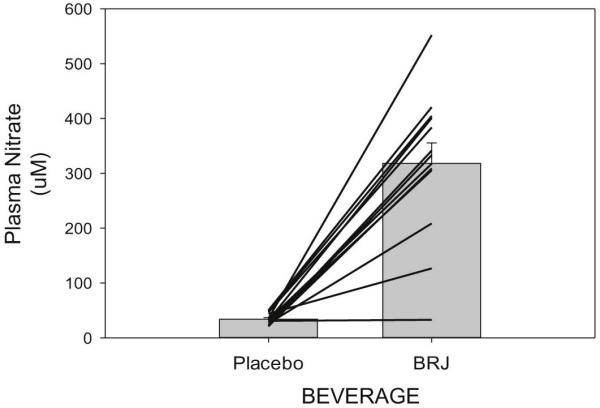
Illustrates plasma nitrate concentrations expressed as uM of plasma. Both individual and mean ± SEM concentrations are shown for the beetroot juice (BRJ) and placebo trials.
Official websites use .gov
A
.gov website belongs to an official
government organization in the United States.
Secure .gov websites use HTTPS
A lock (
) or https:// means you've safely
connected to the .gov website. Share sensitive
information only on official, secure websites.
Illustrates plasma nitrate concentrations expressed as uM of plasma. Both individual and mean ± SEM concentrations are shown for the beetroot juice (BRJ) and placebo trials.