
Figure 4.
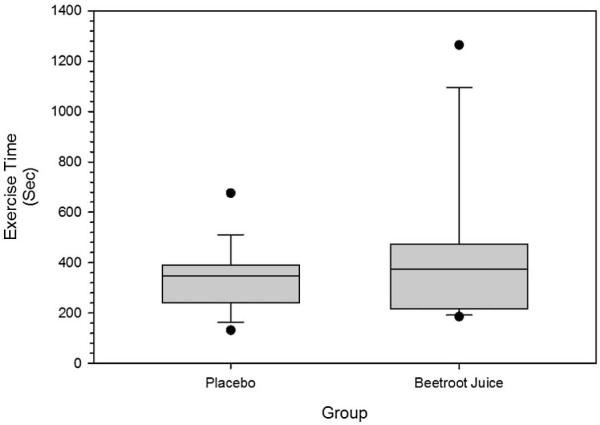
Illustrates submaximal constant work rate exercise time in seconds for both the beetroot juice and placebo trials. Boxes represent the interquartile ranges with the line within each representing the median value. The error bars project to the 10th and 90th percentiles with the circles at each end representing the smallest and largest values.