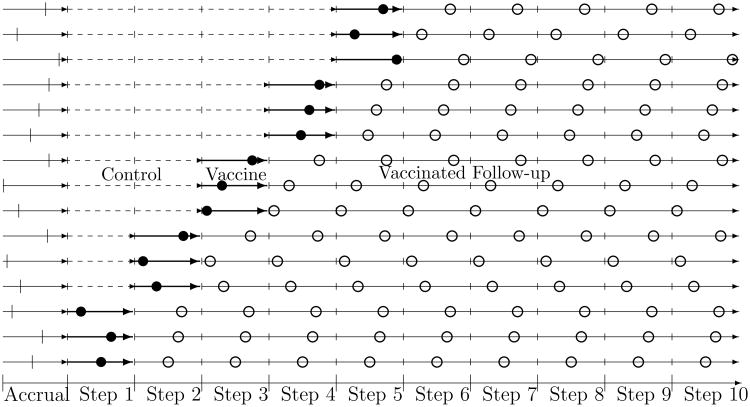
Figure 2.
A sample of three participants from each of five clusters are shown, each randomized to start vaccine in different steps. The dashed lines represent the non-vaccinated follow-up while the solid lines represent the vaccinated follow-up. The hash marks during the accrual period represent participants' dates of entry into the study. The open circles denote the times at which participants are tested for HIV infection and the filled circles denote the times at which the participants are tested for HIV infection and vaccinated if HIV negative.

