Abstract
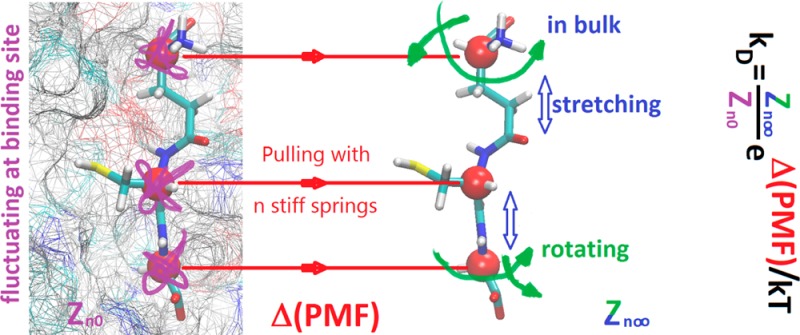
Computing the free energy of binding a ligand to a protein is a difficult task of essential importance for which purpose various theoretical/computational approaches have been pursued. In this paper, we develop a hybrid steered molecular dynamics (hSMD) method capable of resolving one ligand–protein complex within a few wall-clock days with high enough accuracy to compare with the experimental data. This hSMD approach is based on the relationship between the binding affinity and the potential of mean force (PMF) in the established literature. It involves simultaneously steering n (n = 1, 2, 3, ...) centers of mass of n selected segments of the ligand using n springs of infinite stiffness. Steering the ligand from a single initial state chosen from the bound state ensemble to the corresponding dissociated state, disallowing any fluctuations of the pulling centers along the way, one can determine a 3n-dimensional PMF curve connecting the two states by sampling a small number of forward and reverse pulling paths. This PMF constitutes a large but not the sole contribution to the binding free energy. Two other contributors are (1) the partial partition function containing the equilibrium fluctuations of the ligand at the binding site and the deviation of the initial state from the PMF minimum and (2) the partial partition function containing rotation and fluctuations of the ligand around one of the pulling centers that is fixed at a position far from the protein. We implement this hSMD approach for two ligand–protein complexes whose structures were determined and whose binding affinities were measured experimentally: caprylic acid binding to bovine β-lactoglobulin and glutathione binding to Schistosoma japonicum glutathione S-transferase tyrosine 7 to phenylalanine mutant. Our computed binding affinities agree with the experimental data within a factor of 1.5. The total time of computation for these two all-atom model systems (consisting of 96K and 114K atoms, respectively) was less than one wall-clock week using 512 cores (32 Xeon E5-2680 processors).
Introduction
Accurately computing the free energy of binding a ligand to a protein is a task of essential importance in biochemical and biophysical studies that still presents us considerable difficulty to overcome.1−14 An effective approach in the current literature is to use the relationship1,4,14 between the potential of mean force (PMF)15−19 and the binding affinity. The equilibrium approaches, based on PMF or not, are not brute force in nature but require delicate choices of biasing/constraining potentials during the simulation processes. The nonequilibrium steered molecular dynamics (SMD)20−38 approach, seemingly brute force, can be very efficient in sampling forced transition paths from the bound state to the dissociated state of the ligand but has not been used reliably for free-energy calculations with quantitative accuracy.37
In this paper, we present a hybrid steered molecular dynamics (hSMD) approach that produces binding affinities in quantitative agreement with experimental measurements (within a factor of 1.5 in terms of the dissociation constant kD defined as the ligand concentration at which the holoprotein concentration equals the apoprotein concentration). The hSMD approach is based on the relationship between the PMF and the binding affinity in the established literature. The widely used SMD involves pulling one center of mass of one selection of the ligand atoms using a spring of finite, carefully chosen, stiffness. In contrast, the hSMD approach involves pulling n (n = 1, 2, 3, ...) centers of mass of n selected segments of the ligand (using n springs of infinite stiffness to disallow any fluctuation of the pulling centers along the way) to produce a 3n-dimensional (3n-D) PMF curve leading from the binding site on or inside the protein to the dissociated state in the bulk region far from the protein. This PMF difference between the bound state and the dissociated state gives a large (but not dominant) part of the absolute binding free energy. Another part of the hSMD approach is the equilibrium molecular dynamics (MD) sampling of the ligand’s fluctuations at the binding site that also contribute to the binding free energy. The third, final, part of the hSMD approach is SMD stretching and equilibrium MD sampling of the ligand in the dissociated state when one of the n pulling centers is fixed at a point in the bulk far from the protein. This contributes the final piece of the absolute binding free energy.
We carry out applications of this hSMD approach to two ligand–protein complexes whose binding affinities were experimentally measured and whose crystal structures are available: OCA–GLB, caprylic acid (25 atoms, neutral) bound to bovine β-lactoglobulin; and GSH–SjGST(Y7F), glutathione (36 atoms, singly negatively charged) bound to Schistosoma japonicum glutathione S-transferase tyrosine 7 to phenylalanine mutant. The computing times required were approximately 62 wall-clock hours for OCA–GLB (all-atom model of 95 296 atoms) and 88 wall-clock hours for GSH–SjGST(Y7F) (all-atom model of 114 538 atoms), respectively, using 32 Xeon E5-2628 processors (512 cores) in parallel. In each of the two cases, the computed absolute binding free energy agrees well with the experimental data.
Methods
Absolute Binding Energy from the 3n-D PMF
Following the standard literature,1,4 the binding affinity at one binding site is
| 1 |
where c0 is the standard concentration. For clarity and for convenience of unit conversion, we use two different but equivalent forms: c0 = 1 M on the left-hand side and c0 = 6.02 × 10⁻⁴/Å3 on the right-hand side of eq 1. kB is the Boltzmann constant and T is the absolute temperature. The three-dimensional (3D) integrations are over the x-, y-, and z-coordinates of the ligand’s position r1 that can be chosen as the center of mass of one segment of or the whole ligand. The integral has the units of Å3 that renders the right-hand side dimensionless, as it should be. W[r1] is the 3D PMF. The subscripts “site” and “bulk” indicate that r1 is near the PMF minimum and r1 = r1∞ in the bulk region far from the protein, respectively.
For a ligand whose size is not small and whose shape is not simple, the position of one segment center r1 will not be sufficient/efficient to represent its location and situation. Instead, the ligand can be better described with the positions (r1, r2, ..., rn) of n centers of mass of its n chosen segments. Figure 1 shows an example of n = 3, where the positions (r1, r2, r3) of the three α-carbons of glutathione are chosen to quantify the location and situation of the ligand. These n positions fluctuate without being in any way biased/constrained during the equilibrium MD simulation of the bound state. They are steered during the SMD runs from the bound state to the dissociated state for constructing the 3n-D PMF W[r1, r2, ..., rn] as a function of these positions. In the dissociated state, one of them will be fixed at r1 = r1∞ while all others (r2, ..., rn) rotate and fluctuate according to the stochastic dynamics of the system without any other bias/constraint.
Figure 1.
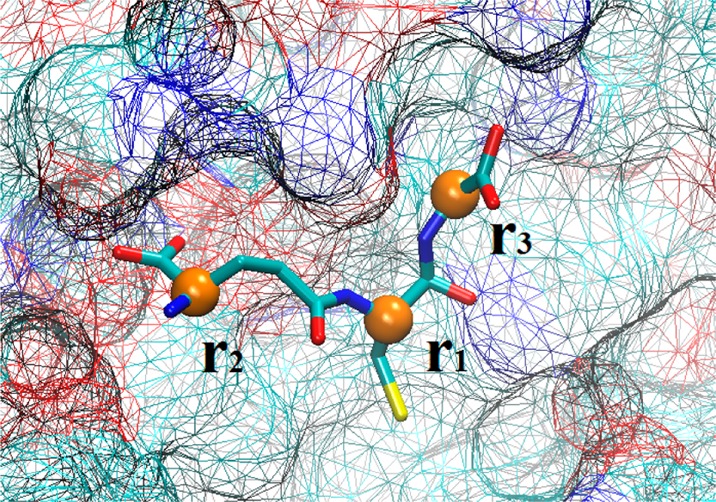
Glutathione (GSH) at the binding site. The coordinates are taken from the PDB (code 1U87). The three α-carbons of GSH are shown as yellow balls marked with their position vectors. The protein surface is shown as wire frames and the ligand is shown as licorice, all colored according to atom names. All graphics of this paper were rendered with VMD.39
Note that in the relationship between the 3D and 3n-D PMFs
| 2 |
the 3(n – 1)-D integration over the (n – 1) positions (r2, ..., rn) is effectively in a defined neighborhood of r1 because the ligand as one whole molecule dictates that the n centers cannot be stretched much farther from one another than its molecular size. When r1 is near the binding site, so will be (r2, ..., rn). When the ligand is in the dissociated state, r1∞ needs to be so far from the protein that integration over (r2, ..., rn) will be all in the region far from the protein. C is the normalization constant that will be canceled out in the following expressions.
Making use of eq 2 twice in eq 1 (for the binding site and for the bulk), one has the following expression for the binding affinity.
| 3 |
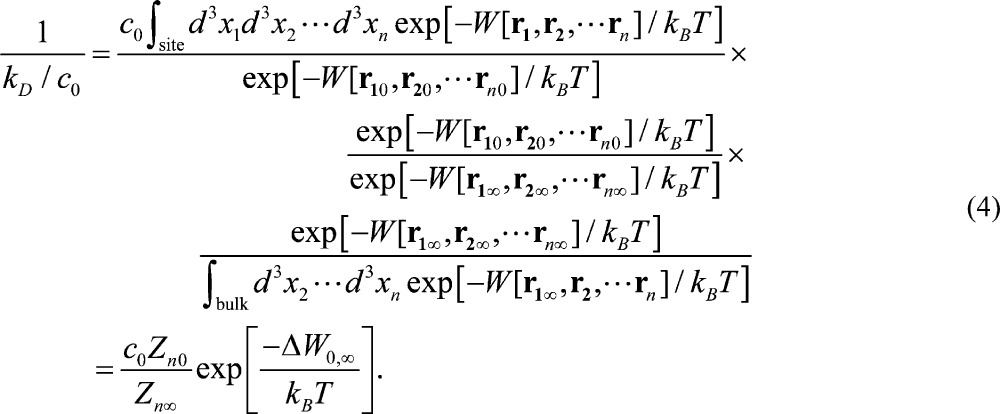
Now inserting the Boltzmann factor at a single state (r10, r20, ..., rn∞) chosen from the bound state ensemble and the Boltzmann factor at the corresponding dissociated state (r1∞, r2∞, ..., rn∞), the binding affinity can be expressed as three contributing factors: the partial partition function at the binding site Zn0, the PMF difference between two chosen states (r10, r20, ..., rn0) and (r1∞, r2∞, ..., rn∞), and the partial partition function in the dissociated state Zn∞. Mathematically
 |
4 |
Here (r1∞, r2∞, ..., rn∞) can be connected to (r10, r20, ..., rn0) via many curves in the 3n-D space, but the PMF is a function of state. Computation of the PMF difference between the two states can be achieved along a single curve passing through them both. The partial partition function Zn0 of the bound state has the integration over all n centers and thus has the units of Å3n.
| 5 |
The partial partition function Zn∞ of the dissociated state has the integration over n – 1 centers and thus has the units of Å3n–3.
| 6 |
Again, the use of c0 = 6.02 × 10⁻⁴/Å3 on the right-hand side of eq 3 renders it a pure number as desired. The dissociation constant will conveniently be in the unit of M = moles per liter.
The 3n-D PMF difference
| 7 |
is between one chosen bound state and its corresponding dissociated state. This PMF difference can be computed by means of the SMD simulations described in the latter part of this section. Note that the one chosen position of the ligand in the bound state
| 8 |
is the starting point for SMD runs. It is taken from the bound state ensemble of the system. It does not have to be the minimum of the PMF but any one state in its close neighborhood. Note that we take the collection of coordinate vectors, e.g., eq 8, as a single-row 1 × 3n matrix. Its transpose in the following eq 13 is a single-column 3n × 1 matrix. The one state chosen from the dissociated state ensemble
| 9 |
is related to the SMD starting point by a large enough displacement in the 3n-D space.
| 10 |
Here vd is the constant velocity of the SMD pulling and t is the time it takes to steer/pull the ligand from the binding site to the bulk.
The reference point for the PMF, W[r1∞, r2∞, ..., rn∞] = 0, is chosen as when the ligand is far from the protein. The absolute free energy of binding is
| 11 |
With all this, one needs to compute three factors to determine the absolute free energy of binding. (1) The first factor is the PMF difference between one chosen bound state and its corresponding dissociated state that can be computed by running SMD simulations of pulling the ligand forward and backward along a 3n-D line connecting the two states. Note that the PMF is a function of state (a point in the 3n-D space) and the PMF difference is independent of the paths connecting the two end points. (2) The second factor is the partial partition function in the bound state that can be approximated as Gaussian in cases of strong binding or can be numerically evaluated by running equilibrium MD simulation. (3) The third factor is the partial partition function in the dissociated state that needs to be computed case by case for n = 2, 3, ....
When the binding is tight, one can approximate the integral of eq 5 as Gaussian in the neighborhood of the PMF minimum. The coordinates of the minimum of a Gaussian distribution are equal to the average coordinates, of course, (⟨r1⟩, ⟨r2⟩, ..., ⟨rn⟩). Carrying out the Gaussian integral, one has
| 12 |
Here the dimensionless quantity Δn/kBT gives a measure of how far (r10, r20, ..., rn0), the initial state chosen for SMD, is from the PMF minimum (⟨r1⟩, ⟨r2⟩, ..., ⟨rn⟩).
 |
13 |
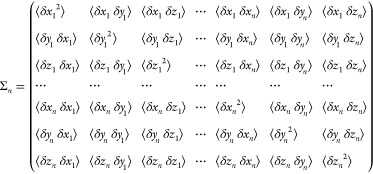
Det represents the determinant. Σn is the 3n × 3n matrix of the fluctuations/deviations of the pulling center coordinates δx1 = x1 – ⟨x1⟩, etc., in the bound state ensemble:
 |
14 |
Σn–1 is the inverse matrix of Σn which can be accurately evaluated by running equilibrium MD in the bound state of the ligand–protein complex. This approximation is generally valid if the ligand does not deviate much from the binding site. However, it is invalid if the binding is extremely weak or the binding site is not well localized. Then one would have to evaluate the 3n-D integral in eq 5 directly by numerical means. To decide whether the Gaussian approximation is suitable or not, one can evaluate how far from the Gaussian distribution is the distribution of the fluctuations at the binding site. Note that this evaluation does not require additional equilibrium MD runs in the bound state of the ligand–protein complex. The only computing effort needed is statistical analysis of the fluctuation data. For example, by computing the first to the fourth moments of the fluctuations and checking their relationships, one can readily determine the non-Gaussian-ness of the fluctuations.
Unlike the partial partition function Zn0 of the bound state, the computation of the partial partition function of the dissociated state, Zn∞ in eq 6, needs to be done individually for each case of n = 1, 2, .... In the following, we detail three cases: n = 1, 2, and 3.
One Center of Mass Is Steered
When one center of mass is steered, n = 1, Z1∞ = 1, all we have to do is to evaluate the fluctuations around the binding site (the 3 × 3 matrix Σ1) along with the PMF difference. In this case, we have the dissociate constant, within the Gaussian approximation of the fluctuations at the binding site
| 15 |
and the absolute free energy of binding the ligand to the protein
| 16 |
It needs to be pointed out that the method of pulling one center of the ligand is only practical for small ligands of simple shapes. Furthermore, the Gaussian approximation of the ligand fluctuations at the binding site in eq 12 is inapplicable to cases of large fluctuations. For example, glycerol binds to GlpF inside the conducting channel40 and its fluctuations inside the channel are large and non-Gaussian. In the computation of its binding affinity, some special attention needs to be paid to the integral of eq 5 instead of using the Gaussian approximation in eq 12.41
Two Centers of Mass Are Steered
When two centers of mass are steered, n = 2, one has
| 17 |
which is an integration over the second steering center when the first steering center is fixed in a position r1∞ far from the protein. All one needs to do now is to evaluate the integral of eq 17 around the position (r1∞, r2∞). Over there, far from the protein, the ligand’s environment is spherically symmetrical around the position of the first pulling center r1∞ that is fixed while the second pulling center r2 is free to sample all space available. Therefore, the 3D integral becomes the following one-dimensional integral:
| 18 |
where r = |r2 – r1∞| is the distance between the two pulling centers. W∞[r] here, as a function of r, is the PMF (reversible work) for stretching the ligand between the two pulling centers. It can be evaluated by conducting SMD runs of steering the second pulling center r2 to and from the first pulling center that is fixed at r1∞ along the axis passing through (r1∞, r2∞). In this, we have the absolute free energy of binding the ligand to the binding site
| 19 |
and the dissociation constant
| 20 |
Here the partial partition function of the dissociated state Z2∞ is given in eq 18 and the partial partition function of the bound state is approximated below as Gaussian.
| 21 |
where Σ2 is a 6 × 6 matrix of coordinate deviations defined in eq 14 and Δ2 is defined in eq 13 with n = 2.
It is worth noting that, for protein–ligand complexes whose binding is strong, the computation of Z20 and Z2∞ can be carried out efficiently with sufficient accuracy. However, the computation of the PMF difference W[r10, r20] – W[r1∞, r2∞] may be difficult. Particularly, if the orientational entropy plays a large role, one needs to pull three or more centers of the ligand segments.
Three Centers of Mass Are Steered
When three centers of mass are steered, n = 3, we need to evaluate the integral of eq 6 around the position (r1∞, r2∞, r3∞) when the ligand is far from the protein. Over there, the ligand’s environment is spherically symmetrical around the position of the first pulling center r1∞ that is fixed while the second and the third pulling centers r2 and r3 are free to sample all space available. The PMF W[r1∞, r2, r3] is only dependent upon three of the six degrees of freedom contained in (r2, r3). Namely
| 22 |
where r21 = |r2 – r1∞| and r31 = |r3 – r1∞| are the distances between the second/third pulling center and the first pulling center that is fixed at r1∞. θ is the angle between (r2 – r1∞) and (r3 – r1∞). Therefore, the six-dimensional integral of eq 6 becomes the following 3D integral:
| 23 |
In terms of the 3D probability distribution ρ(r21, r31, θ), the integral becomes
| 24 |
which can be evaluated by equilibrium sampling in the 3D space (r21, r31, θ) from MD runs with r1 being fixed at r1∞. θ∞ is the angle between (r2∞ – r1∞) and (r3∞ – r1∞), of course.
If the equilibrium sampling in 3D cannot be achieved with sufficient accuracy, we can approximate the PMF as three separable terms:
| 25 |
Correspondingly, we obtain
| 26 |
Here γ is a factor negating the possible error introduced in eq 25. The PMF W∞[r21], as a function of the distance between the two pulling centers r21, can be evaluated by conducting SMD runs of steering the second pulling center r2 to and from the first pulling center that is fixed at r1∞ along the axis passing through (r1∞, r2∞). The PMF W∞[r31], as a function of the distance between the two pulling centers r31, can be evaluated by conducting SMD runs of steering the third pulling center r3 to and from the first pulling center that is fixed at r1∞ along the axis passing through (r1∞, r3∞). The θ-integral can be approximated by conducting equilibrium MD runs with the first pulling center fixed at r1∞ to sample angular distribution.
Note that the direct sampling method in eq 24 is exact but it requires sufficient sampling in the 3D phase space (r21, r31, θ), which is not an easy task. The approximation eq 26 can be evaluated with much less sampling effort in the dissociated state, but it involves the approximation in eq 25 that is somewhat arbitrary. When the two methods produce similar results (as is the case in this work), one can be confident of the computation, of course.
After all this, we have the free energy of binding the ligand to the binding site:
| 27 |
The corresponding binding affinity is
| 28 |
Note that, by pulling three centers of the ligand, it is easier to compute the PMF difference W[r10, r20, r30] – W[r1∞, r2∞, r3∞] as the overall orientation of the ligand is fixed along the pulling paths. Also, the computation of Z30 is not difficult for complexes of strong binding whose equilibrium fluctuations can be well approximated as Gaussian:
| 29 |
where Σ3 is a 9 × 9 matrix of coordinate deviations defined in eq 14 and Δ3 is defined in eq 13 with n = 3. However, the computation of Z3∞ will be considerably more elaborate than Z2∞. Nevertheless, for long ligands of irregular shapes, pulling three or more centers should be the optimal method for accurately computing the binding free energy or binding affinity.
PMF from SMD Simulations
In an SMD20 simulation of the current literature, one steers/pulls one center of mass of one selection of atoms, using a spring with a carefully chosen stiffness (spring constant). The use of a spring of finite stiffness introduces fluctuations and dissipation in the added degrees of freedom.35 In this paper, we choose n segments (mutually exclusive n selections of atoms) of the ligand molecule for steering/pulling with n infinitely stiff springs (n = 1, 2, 3, ...). Namely, the n centers of mass of the chosen n segments will be controlled as functions of time t
| 30 |
while all the other degrees of freedom of the system are freely subject to stochastic dynamics. Here ri = (xi, yi, zi) is the center of mass coordinates of the ith segments. vd is the pulling velocity. The + and – signs are for the forward and reverse pulling paths, respectively. {ri} denotes (r1, r2, ..., rn), etc. We adopt the multisectional scheme of ref (41). The path from the bound state to the dissociated state is divided into a number of sections. Within a given section whose end states are marked as A and B, respectively, multiple forward and reverse pulling paths are sampled along which the work done to the system is recorded. The Gibbs free energy difference (namely, the PMF or the reversible work) is computed via the Brownian dynamics fluctuation–dissipation theorem (BD-FDT)42 as follows:
| 31 |
Here the brackets with subscript “F” and “R” represent the statistical average over the forward/reverse paths. W{riA} → {ri} is the work done to the system along a forward path when the ligand is steered from A to r. W{ri}→{riA} = W{riB}→{riA} – W{riB}→{ri} is the work for the part of a reverse path when the ligand is pulled from r to A. {riA}, {ri}, and {riB} are the coordinates of the centers of mass of the steered segments of the ligand at the end state A, the general state r, and the end state B of the system, respectively. At each end of a section, A/B, the system is equilibrated for a time long enough to reach conditioned equilibrium while the steered centers are fixed at {riA}/{riB}. In this way, running SMD section by section, we map the PMF W[{ri}] as a function of the steered centers along a chosen path from the ligand’s bound state to its dissociated state.
Simulation Parameters
In all the equilibrium MD and nonequilibrium SMD runs, we used the CHARMM3643,44 force field for all intra- and intermolecular interactions. We implemented Langevin stochastic dynamics with NAMD45 to simulate the systems at a constant temperature of 298 K and a constant pressure of 1 bar. Full electrostatics was implemented by means of particle mesh Ewald (PME) at 128 × 128 × 128. The time step was 1 fs for short-range interactions and 2 fs for long-range interactions. The PME was updated every 4 fs. The damping constant was 5/ps. Explicit solvent was represented with the TIP3P model. Selected α-carbons on α-helices and β-sheets far from the binding site are fixed to their crystal structure coordinates, fully respecting the experimentally determined ligand–protein structures. The pulling was along the z-axis at a speed of 2.5 Å/ns in all SMD runs. Namely, vd = (0, 0, 2.5 Å/ns).
Results
OCA Binding to LGB
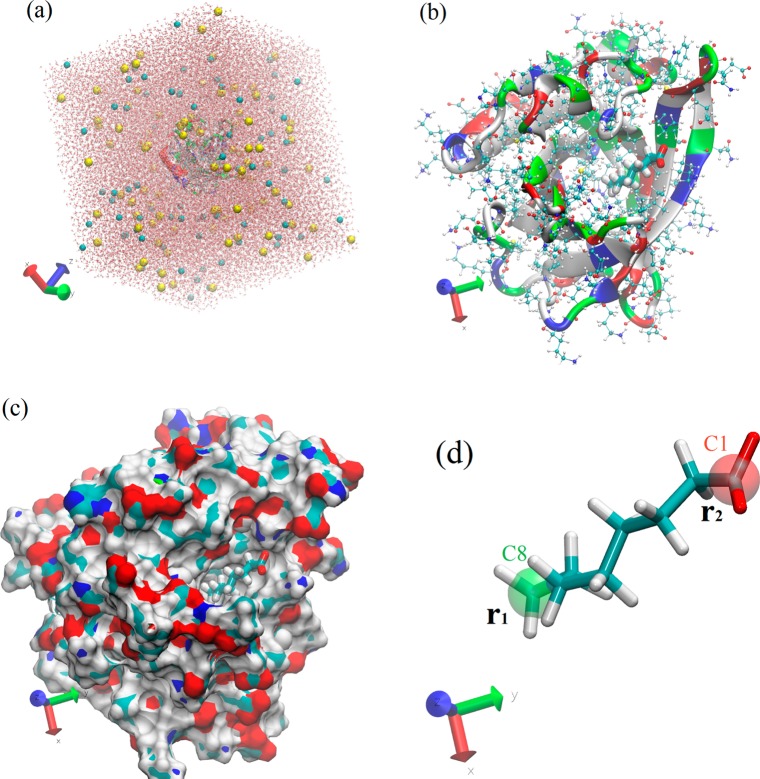
The simulation system of the OCA–LGB complex46 is illustrated in Figure 2, which was set up by taking the crystal structure of the protein–ligand complex from the PDB (code 3NQ9), putting it in the center of a box of water, neutralizing the system, and then salinating it with Na+ and Cl– ions to the concentration of 150 mM. Running equilibrium MD for 25 ns leads to the equilibrated system shown in Figure 2. In particular, the equilibrium structure of OCA bound to the protein is shown in Figure 2d, where the C8 (position vector r1) and C1 atoms (position vector r2) were highlighted with the green and red balloons, respectively. These two atoms were chosen as the two steering/pulling centers for the nonequilibrium SMD runs.
Figure 2.
(a) The in silico system box of the OCA–LGB complex (95 296 atoms, 100 Å × 100 Å × 92 Å in dimension). Na+ and Cl– ions are represented by VDW (spheres) colored in yellow and cyan, respectively; water is represented by red and white dots; protein is represented by ribbons colored by residue types; and the ligand (not easily visible) is represented by licorices colored according to atom names. (b) Caprylic acid bound to bovine β-lactoglobulin. Caprylic acid, visible on top of the figure, is represented by licorice while protein is represented by ribbons and by CPK (ball-and-stick), both colored according to residue types. (c) Caprylic acid (in licorice colored in green) resides in the binding pocket of the protein (in surface representation colored according to atom names). (d) Caprylic acid in licorice representation colored according to atom names. The two groups (highlighted in red and green respectively) are selected for steering/pulling.
At the binding site, the two pulling centers (r1, r2) fluctuate inside the binding pocket with small amplitudes (shown in the Supporting Information, Figure S1). These fluctuations give us the following statistics at the binding site: the determinant of the deviation matrix Det(Σ2) = 2.42 × 10⁻¹ Å12 and the deviation of the SMD initial state from the PMF minimum Δ2 = 1.68 kcal/mol.
Conducting multiple SMD runs starting from the initial state (r10, r20) to the final state (r1∞, r2∞) along the z-axis, we sampled four forward and four reverse pulling paths connecting the two states. The curves of work done to the system along the pulling paths are shown in the Supporting Information, Figure S2. From those work curves, we computed the PMF as a function of the z-displacement Δz shown in Figure 3a. This PMF curve gives us the PMF difference between the one chosen bound state and its corresponding dissociated state:
| 32 |
Figure 3.
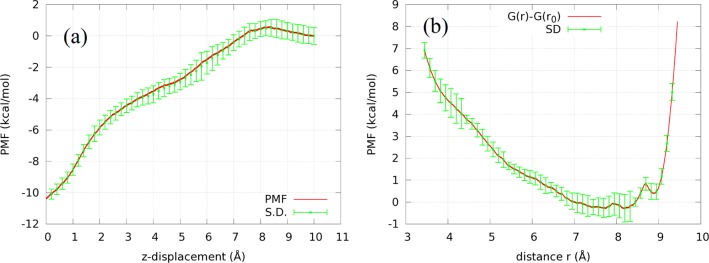
(a) PMF W[r1, r2] as a function of the ligand displacement from its binding site along the pulling path when two centers are steered away from the protein. (b) PMF W∞[r] in the dissociated state as a function of the distance r between the two steered centers (the C1 and C8 atoms). W∞[r0] = 0 where r0 = 8.40 Å is the distance between C1 and C8 atoms of OCA at the binding site.
Note that the PMF rises gradually all the way until Δz = 8 Å as the ligand is steered out of the binding pocket. After that, the PMF levels off. This behavior clearly reflects the hydrophobic nature of the deep binding pocket of LGB and that of OCA’s long hydrocarbon chain.46 The van der Waals attraction between OCA and LGB is gradually reduced along the dissociation path, and meanwhile, the hydrophobic surfaces of LGB and OCA are increasingly exposed to water as they are steered apart from one another. These two together are responsible for binding OCA’s hydrocarbon chain inside LGB’s β-barrel, giving rise to a large part of the binding free energy. There are two other parts of the binding free energy: First, fluctuations of OCA inside the barrel as represented by Z20. Second, the rotation and fluctuations of OCA in the dissociated state represented by Z2∞.
In the dissociated state, we fixed the C8 atom at r1∞ and steered the C1 atom (position vector r2) toward and away from C8, sampling four forward paths and four reverse paths (shown in the Supporting Information, Figure S2). From the work curves along those pulling paths, we obtained the PMF W∞[r] in the dissociated state as a function of the C1–C8 distance r shown in Figure 3b. Carrying out the integral of eq 18 using this PMF curve, we obtained the partial partition function in the dissociated state Z2∞ = 2.01 × 10³ Å3.
It is not surprising to note that the ligand conformation in the bound state represented by the distance between the two pulling centers (C1 and C8 atoms)
| 33 |
is not optimal in the dissociated state. For a range of r values, the PMF has lower values:
| 34 |
In the bulk region, away from the protein, the linear OCA hydrocarbon carbon chain will fluctuate more freely than in the binding pocket of LGB. These effects constitute a significant contribution to the binding free energy represented in the partial partition function Z2∞.
Putting all the afore-presented results together into eq 19, we obtain the absolute binding energy of −5.7 ± 0.6 kcal/mol (corresponding to a dissociation constant of kD = 71 μM) that is in comparison with the in vitro result of −5.5 kcal/mol (kD = 92.6 μM).47
GSH Binding to SjGST(Y7F)
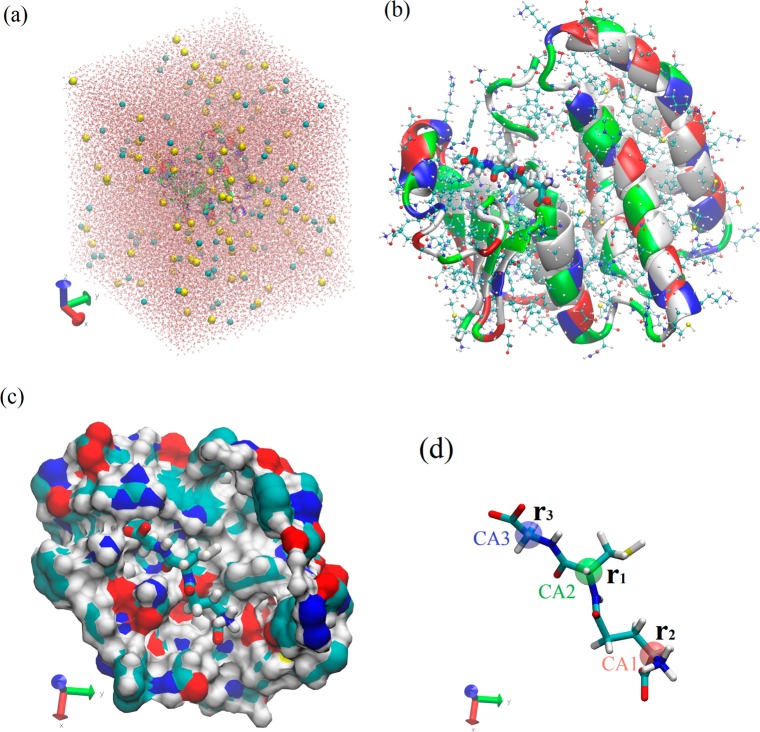
The simulation system box of the GSH–SjGST(Y7F) complex48 was set up by taking the crystal structure of the protein–ligand complex from the PDB (code 1U87), putting it in the center of a box of water, neutralizing the system, and then salinating it with Na+ and Cl– ions to the concentration of 150 mM. Running equilibrium MD for 30 ns leads to the equilibrated system shown in Figure 4. In particular, the equilibrium structure of glutathione is shown in Figure 4d, where the three α-carbons CA1 (position vector r2), CA2 (position vector r1), and CA3 (position vector r3), were highlighted with the red, green, and blue balloons, respectively. These three atoms were chosen as the three steering/pulling centers for the nonequilibrium SMD runs.
Figure 4.
(a) The in silico system box (114 538 atoms, 100 Å × 100 Å × 113 Å in dimension). Na+ and Cl– ions are represented by VDW (spheres) colored in yellow and cyan respectively; water is represented by red (oxygen) and white (hydrogen) balls and sticks (CPK); protein is represented by ribbons colored according to residue types; and the ligand GSH (not easily visible) is represented by licorices colored according to atom names. (b) GSH (licorice colored according to atom names) in complex with the protein (ribbons colored according to residue types and CPK colored according to atom names). (c) GSH (licorice colored according to atom names) in the binding pocket. Here the protein surface (colored according to atom names) near or around the binding site is shown. (d) GSH in licorice with its three α-carbons bubbled in red (CA1), green (CA2), and blue (CA3) balloons. These three α-carbons are chosen as the three pulling centers. The orientation of GSH here is identical to (c).
At the binding site, the three pulling centers (r1, r2, r3) fluctuate inside the binding pocket with small amplitudes (shown in the Supporting Information, Figure S3). These fluctuations give us the following statistics at the binding site: The determinant of the deviation matrix Det(Σ3) = 2.53 × 10⁻¹¹ Å18 and the deviation of the SMD initial state from the PMF minimum Δ3 = 5.78 kcal/mol.
Conducting multiple SMD runs starting from the initial state (r10, r20, r30) to the final state (r1∞, r2∞, r3∞) along the z-axis, we sampled four forward and four reverse pulling paths connecting the two states. The curves of work done to the system along the pulling paths are shown in the Supporting Information, Figure S4. From those work curves, we computed the PMF as a function of the z-displacement (shown in Figure 5). This PMF curve gives us the PMF difference between the one chosen bound state and its corresponding dissociated state.
| 35 |
Figure 5.
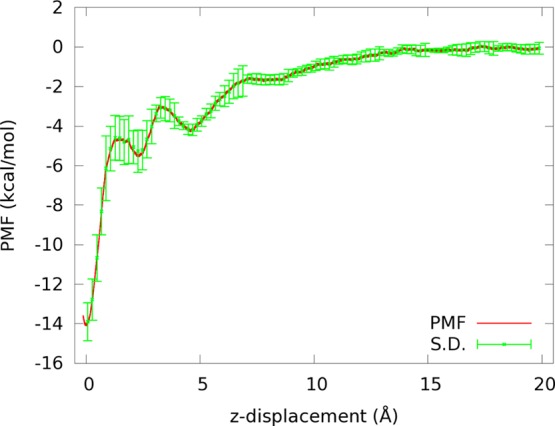
PMF W[r1, r2, r3] along the path of pulling GSH out of the binding pocket.
Note that the shape of GSH is irregular. Pulling its center of mass (n = 1) would not be efficient for sampling the relevant phase space. Pulling three centers (n = 3) turned out to be effective as indicated in the PMF curve of Figure 5. The PMF rises most rapidly during the first 1.5 Å of displacement, showing effectiveness of pulling the three α-carbons of GSH simultaneously to separate its backbone from the protein. From 1.5 to 7 Å the oscillatory rise in PMF indicates separation of GSH side chains from the protein. After that, the PMF gradually rises some more and then levels off after 15 Å, indicating the ligand is in the bulk region (dissociated from the protein). Pulling three centers here is advantageous over pulling one center because the separation of the ligand from the protein, if pulled by one center, involves tight entanglement of the ligand’s fluctuations in conformation and in orientation with the fluctuations of the many residues at and near the binding site. By pulling three centers, the ligand conformation and orientation are not allowed to fluctuate. Their fluctuations are sampled in the dissociated state far from the protein. This disentanglement of two sets of fluctuations turned out to be very effective.
In the dissociated state, we computed the partial partition function Z3∞ in two ways. First, we used eq 24 on the long time equilibrium fluctuations of CA1 (r2) and CA3 (r3) around CA2 (fixed at r1∞) shown in the Supporting Information, Figure S5. Second, we computed the PMFs in eq 26. Fixing CA2 at r1∞, we conducted SMD runs steering CA1 (r2) toward and away from CA2, sampling four forward and four reverse pulling paths (shown in the Supporting Information, Figure S6a). Likewise, steering CA3 (r3) toward and away from CA2, we sampled four forward and four reverse pulling paths (shown in the Supporting Information, Figure S6b). From those work curves, we extracted the PMF W∞[r21] as a function of the CA1–CA2 distance in Figure 6a and the PMF W∞[r31] as a function of the CA3–CA2 distance in Figure 6b. Meanwhile, we approximate W∞[θ] ≈ 0 and γ ≈ 1. With all these put together into eq 26, we obtained the partition function Z3∞ in the dissociated state. In two different ways described above, we obtained identical results for the partial partition function of the dissociated state, Z3∞ = 1.2 × 10⁴ Å6.
Figure 6.
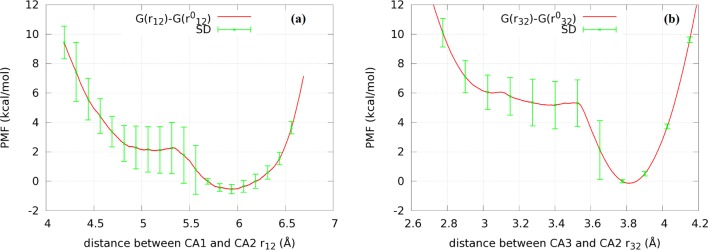
(a) PMF W∞[r21] as a function of the CA1–CA2 distance in the dissociated state. (b) PMF W∞[r31] as a function of the CA3–CA2 distance in the dissociated state. CA2 is fixed at r1∞. CA1 (position vector r2) and CA3 (position vector r3) are steered to and from CA2 in (a) and (b), respectively.
It is interesting to note that the PMF W∞[r31] (Figure 6b) has a deep, nearly harmonic well centered at a CA3–CA2 distance r31 ∼ |r3∞ – r1∞| = |r30 – r10| = 3.8 Å. This indicates that binding GSH to the protein does not significantly stretch CA3 from CA2. In contrast, the PMF W∞[r21] as a function of the CA1–CA2 distance (Figure 6a) behaves very differently. The PMF well is anharmonic and its minimum is lower than the PMF value at the CA1–CA2 distance |r2∞ – r1∞| = |r20 – r10| = 6.2 Å of the bound state. Binding GSH to the protein actually causes CA1 to stretch away from CA2 and reduces the fluctuations of CA1. This gives rise to a nonnegligible contribution to the binding free energy.
Putting together the bound state fluctuations, the PMF difference, and the dissociated state fluctuations into eq 27, we obtain the absolute binding energy of −7.0 ± 0.9 kcal/mol (corresponding to a dissociation constant of kD = 8.2 μM) that is in comparison with the ITC result of −6.75 kcal/mol (kD = 13 μM).49
Discussion
In terms of a computational approach, we have developed a hybrid steered molecular dynamics approach for computing absolute binding energy from the PMF along a dissociation path. Applying this hSMD approach with high-performance parallel processing, one can achieve, within a few wall-clock days, the computation of the binding affinity of one ligand–protein complex with accuracy comparable with experimental measurements. The hSMD approach is “brute force” in the sense that one does not have to delicately devise biasing and constraining potentials during the course of simulations. Also, it does not involve sophisticated ways of removing the artifacts introduced by biasing/constraining the ligand in other PMF-based and non-PMF-based approaches. hSMD can be implemented straightforwardly by steering/pulling the n centers of mass of n chosen segments of a ligand using n infinitely stiff springs along one predetermined dissociate path, disallowing any deviations from the path. This use of a single path is correct because the PMF is a function of state. Therefore, the PMF difference between two states is independent of the paths connecting them. All other contributions, in addition to the PMF difference between the two end states of this one dissociation path, are rigorously accounted for in the partial partition functions of the bound and the dissociated states. The segments chosen to be steered, however, need to be the most stable parts of the ligand in the bound state because the coordinate integrations of these centers then can be approximated as Gaussian. The Gaussian approximation is expected to be valid for a wide range of ligand–protein complexes because there should always be at least one center of a ligand that does not deviate greatly from its bound-state coordinates but is tightly bound to the protein except for the cases of very weak binding. Another possible difficulty for the hSMD approach lies in the coordinate integration in the dissociated state when three segments’ centers of mass are steered. The approximation in eq 26 is based on the assumptions that two of the three pulling centers do not have significant contribution from the stereo collision between them and that the angle between the lines they form with the other center is approximately free to bend. When these two assumptions are not valid, the coordinate integration in eq 23 will necessitate further new schemes of approximation.
In terms of biophysics, we have provided atomistic details in support of the binding mechanisms of two ligand–protein complexes elucidated in the experimental investigations.46−49 For both OCA–GLB and GSH–SjGST(Y7F) complexes, our equilibrium MD simulations confirm the experimentally determined binding conformations. During the long time dynamics, the ligands were found to fluctuate with small deviations at the binding sites determined in the crystal structures of the ligand–protein complexes (see Figures 2b,c and 4b,c and the Supporting Information, Figures S1 and S3). Also, our computed dissociation constants agree with the experimentally measured values within a factor of 1.5. Therefore, it is expected that hSMD can be used to reliably predict binding affinities of ligand–protein complexes whose structures are available in the PDB without data for binding affinities yet and that the hSMD predictions would be validated by future experimental measurements. Finally, the agreement between the computed results in this work and the experimental data was based on the CHARMM force field, indicating its accuracy. The hSMD approach, however, is independent of which force field to use. It can be implemented with other force fields, of course, which may or may not produce similar results.
Acknowledgments
The author thanks Oscar Villarreal for checking the formulas in the Methods section. He acknowledges support from the NIH (GM 084834) and the computing resources provided by the Texas Advanced Computing Center at University of Texas at Austin.
Glossary
Abbreviations
- 3D
three-dimensional
- 3n-D
3n-dimensional
- GlpF
Escherichia coli glycerol uptake facilitator protein
- GSH
glutathione
- hSMD
hybrid steered molecular dynamics
- ITC
isothermal titration calorimetry
- kD
dissociation constant
- LGB
bovine β-lactoglobulin
- MD
molecular dynamics
- OCA
caprylic acid, octanoic acid
- PDB
Protein Data Bank
- PME
particle mesh Ewald
- PMF
potential of mean force
- SjGST(Y7F)
Schistosoma japonicum glutathione S-transferase tyrosine 7 to phenylalanine mutant
- SMD
steered molecular dynamics
- VDW
van der Waals
Supporting Information Available
Details of the data produced in MD and SMD runs that are used to compute the binding affinities are shown in Figures S1–S6. This material is available free of charge via the Internet at http://pubs.acs.org.
The authors declare no competing financial interest.
Funding Statement
National Institutes of Health, United States
Supplementary Material
References
- Woo H.-J.; Roux B. Calculation of absolute protein–ligand binding free energy from computer simulations. Proc. Natl. Acad. Sci. U. S. A. 2005, 102196825–6830. [DOI] [PMC free article] [PubMed] [Google Scholar]
- Ytreberg F. M.; Swendsen R. H.; Zuckerman D. M. Comparison of free energy methods for molecular systems. J. Chem. Phys. 2006, 12518184114. [DOI] [PubMed] [Google Scholar]
- Mobley D. L.; Dill K. A. Binding of Small-Molecule Ligands to Proteins: “What You See” Is Not Always “What You Get. Structure 2009, 174489–498. [DOI] [PMC free article] [PubMed] [Google Scholar]
- Zhou H.-X.; Gilson M. K. Theory of Free Energy and Entropy in Noncovalent Binding. Chem. Rev. 2009, 10994092–4107. [DOI] [PMC free article] [PubMed] [Google Scholar]
- General I. J. A Note on the Standard State’s Binding Free Energy. J. Chem. Theory Comput. 2010, 682520–2524. [DOI] [PubMed] [Google Scholar]
- Hou T.; Wang J.; Li Y.; Wang W. Assessing the Performance of the MM/PBSA and MM/GBSA Methods. 1. The Accuracy of Binding Free Energy Calculations Based on Molecular Dynamics Simulations. J. Chem. Inf. Model. 2010, 51169–82. [DOI] [PMC free article] [PubMed] [Google Scholar]
- Cai L.; Zhou H.-X. Theory and simulation on the kinetics of protein–ligand binding coupled to conformational change. J. Chem. Phys. 2011, 13410105101. [DOI] [PMC free article] [PubMed] [Google Scholar]
- Chodera J. D.; Mobley D. L.; Shirts M. R.; Dixon R. W.; Branson K.; Pande V. S. Alchemical free energy methods for drug discovery: progress and challenges. Curr. Opin. Struct. Biol. 2011, 212150–160. [DOI] [PMC free article] [PubMed] [Google Scholar]
- Gallicchio E.; Levy R. M. Recent theoretical and computational advances for modeling protein–ligand binding affinities. Adv. Protein Chem. Struct. Biol. 2011, 85, 27–80. [DOI] [PMC free article] [PubMed] [Google Scholar]
- General I. J.; Dragomirova R.; Meirovitch H. Absolute Free Energy of Binding of Avidin/Biotin, Revisited. J. Phys. Chem. B 2012, 116236628–6636. [DOI] [PMC free article] [PubMed] [Google Scholar]
- Wu X.; Damjanovic A.; Brooks B. R. Efficient and Unbiased Sampling of Biomolecular Systems in the Canonical Ensemble: A Review of Self-Guided Langevin Dynamics. Adv. Chem. Phys. 2012, 150, 255–326. [DOI] [PMC free article] [PubMed] [Google Scholar]
- Gumbart J. C.; Roux B.; Chipot C. Standard Binding Free Energies from Computer Simulations: What Is the Best Strategy?. J. Chem. Theory Comput. 2013, 91794–802. [DOI] [PMC free article] [PubMed] [Google Scholar]
- Zeller F.; Zacharias M. Evaluation of Generalized Born Model Accuracy for Absolute Binding Free Energy Calculations. J. Phys. Chem. B 2014, 118277467–7474. [DOI] [PubMed] [Google Scholar]
- Doudou S.; Burton N. A.; Henchman R. H. Standard Free Energy of Binding from a One-Dimensional Potential of Mean Force. J. Chem. Theory Comput. 2009, 54909–918. [DOI] [PubMed] [Google Scholar]
- Kirkwood J. G. Statistical Mechanics of Fluid Mixtures. J. Chem. Phys. 1935, 35300–313. [Google Scholar]
- Chandler D. Statistical mechanics of isomerization dynamics in liquids and the transition state approximation. J. Chem. Phys. 1978, 6862959–2970. [Google Scholar]
- Pratt L. R.; Hummer G.; Garciá A. E. Ion pair potentials-of-mean-force in water. Biophys. Chem. 1994, 512–3147–165. [Google Scholar]
- Roux B. The calculation of the potential of mean force using computer simulations. Comput. Phys. Commun. 1995, 911–3275–282. [Google Scholar]
- Allen T. W.; Andersen O. S.; Roux B. Molecular dynamics—potential of mean force calculations as a tool for understanding ion permeation and selectivity in narrow channels. Biophys. Chem. 2006, 1243251–267. [DOI] [PubMed] [Google Scholar]
- Isralewitz B.; Izrailev S.; Schulten K. Binding pathway of retinal to bacterio-opsin: A prediction by molecular dynamics simulations. Biophys. J. 1997, 7362972–2979. [DOI] [PMC free article] [PubMed] [Google Scholar]
- Gullingsrud J. R.; Braun R.; Schulten K. J. Reconstructing potentials of mean force through time series analysis of steered molecular dynamics simulations. Biophys. J. 1999, 761A200. [Google Scholar]
- Jensen M. O.; Park S.; Tajkhorshid E.; Schulten K. Energetics of glycerol conduction through aquaglyceroporin GlpF. Proc. Natl. Acad. Sci. U. S. A. 2002, 99106731–6736. [DOI] [PMC free article] [PubMed] [Google Scholar]
- Tajkhorshid E.; Aksimentiev A.; Balabin I.; Gao M.; Isralewitz B.; Phillips J. C.; Zhu F. Q.; Schulten K. Large scale simulation of protein mechanics and function. Adv. Protein Chem. 2003, 66, 195–247. [DOI] [PubMed] [Google Scholar]
- Li P. C.; Makarov D. E. Simulation of the mechanical unfolding of ubiquitin: Probing different unfolding reaction coordinates by changing the pulling geometry. J. Chem. Phys. 2004, 121104826–4832. [DOI] [PubMed] [Google Scholar]
- Park S.; Schulten K. Calculating potentials of mean force from steered molecular dynamics simulations. J. Chem. Phys. 2004, 120135946–5961. [DOI] [PubMed] [Google Scholar]
- Jensen M. O.; Yin Y.; Tajkhorshid E.; Schulten K. Sugar transport across lactose permease probed by steered molecular dynamics. Biophys. J. 2007, 93192–102. [DOI] [PMC free article] [PubMed] [Google Scholar]
- Wang Y.; Zhang L. X. Steered molecular dynamics simulation of elastic behavior of adsorbed single polyethylene chains. J. Polym. Sci., Part B: Polym. Phys. 2007, 45162322–2332. [Google Scholar]
- Minh D. D. L.; McCammon J. A. Springs and speeds in free energy reconstruction from irreversible single-molecule pulling experiments. J. Phys. Chem. B 2008, 112195892–5897. [DOI] [PubMed] [Google Scholar]
- Chen L. Y. Exploring the free-energy landscapes of biological systems with steered molecular dynamics. Phys. Chem. Chem. Phys. 2011, 13136176–6183. [DOI] [PMC free article] [PubMed] [Google Scholar]
- Trinh T.; Lastoskie C.; Epstein T.; Philbert M. Steered Molecular Dynamics Simulation of Kinesin Detachment from the Microtubule Surface. Biophys. J. 2011, 1003194–195. [Google Scholar]
- Fukunishi H.; Shimada J.; Shiraishi K. Antigen-Antibody Interactions and Structural Flexibility of a Femtomolar-Affinity Antibody. Biochemistry 2012, 51122597–2605. [DOI] [PubMed] [Google Scholar]
- Moradi M.; Tajkhorshid E. Driven Metadynamics: Reconstructing Equilibrium Free Energies from Driven Adaptive-Bias Simulations. J. Phys. Chem. Lett. 2013, 4111882–1887. [DOI] [PMC free article] [PubMed] [Google Scholar]
- Nicolini P.; Frezzato D.; Gellini C.; Bizzarri M.; Chelli R. Toward quantitative estimates of binding affinities for protein-ligand systems involving large inhibitor compounds: A steered molecular dynamics simulation route. J. Comput. Chem. 2013, 34181561–1576. [DOI] [PubMed] [Google Scholar]
- Trinh T. D.; Philbert M. A.; Lastoskie C. M. Steered Molecular Dynamics Simulation of Kinesin Detachment from the Microtubule Surface and the Effect of 1,3-Dinitrobenzene. Biophys. J. 2013, 1042332a–333a.23442855 [Google Scholar]
- Velez-Vega C.; Gilson M. K. Overcoming Dissipation in the Calculation of Standard Binding Free Energies by Ligand Extraction. J. Comput. Chem. 2013, 34272360–2371. [DOI] [PMC free article] [PubMed] [Google Scholar]
- Yu T.; Lee O. S.; Schatz G. C. Steered Molecular Dynamics Studies of the Potential of Mean Force for Peptide Amphiphile Self-Assembly into Cylindrical Nanofibers. J. Phys. Chem. A 2013, 117327453–7460. [DOI] [PubMed] [Google Scholar]
- Baştuğ T.; Chen P.-C.; Patra S. M.; Kuyucak S. Potential of mean force calculations of ligand binding to ion channels from Jarzynski’s equality and umbrella sampling. J. Chem. Phys. 2008, 12815155104. [DOI] [PubMed] [Google Scholar]
- Jeřábek P.; Florián J.; Stiborová M.; Martínek V. Flexible Docking-Based Molecular Dynamics/Steered Molecular Dynamics Calculations of Protein–Protein Contacts in a Complex of Cytochrome P450 1A2 with Cytochrome b5. Biochemistry 2014, 53426695–6705. [DOI] [PubMed] [Google Scholar]
- Humphrey W.; Dalke A.; Schulten K. VMD: Visual molecular dynamics. J. Mol. Graphics 1996, 14133–38. [DOI] [PubMed] [Google Scholar]
- Fu D.; Libson A.; Miercke L. J. W.; Weitzman C.; Nollert P.; Krucinski J.; Stroud R. M. Structure of a Glycerol-Conducting Channel and the Basis for Its Selectivity. Science 2000, 2905491481–486. [DOI] [PubMed] [Google Scholar]
- Chen L. Y. Glycerol modulates water permeation through Escherichia coli aquaglyceroporin GlpF. Biochim. Biophys. Acta, Biomembr. 2013, 182881786–1793. [DOI] [PMC free article] [PubMed] [Google Scholar]
- Chen L. Y. Nonequilibrium fluctuation-dissipation theorem of Brownian dynamics. J. Chem. Phys. 2008, 12914144113–144114. [DOI] [PMC free article] [PubMed] [Google Scholar]
- Brooks B. R.; Brooks C. L.; Mackerell A. D.; Nilsson L.; Petrella R. J.; Roux B.; Won Y.; Archontis G.; Bartels C.; Boresch S.; Caflisch A.; Caves L.; Cui Q.; Dinner A. R.; Feig M.; Fischer S.; Gao J.; Hodoscek M.; Im W.; Kuczera K.; Lazaridis T.; Ma J.; Ovchinnikov V.; Paci E.; Pastor R. W.; Post C. B.; Pu J. Z.; Schaefer M.; Tidor B.; Venable R. M.; Woodcock H. L.; Wu X.; Yang W.; York D. M.; Karplus M. CHARMM: The biomolecular simulation program. J. Comput. Chem. 2009, 30101545–1614. [DOI] [PMC free article] [PubMed] [Google Scholar]
- Vanommeslaeghe K.; Hatcher E.; Acharya C.; Kundu S.; Zhong S.; Shim J.; Darian E.; Guvench O.; Lopes P.; Vorobyov I.; Mackerell A. D. CHARMM general force field: A force field for drug-like molecules compatible with the CHARMM all-atom additive biological force fields. J. Comput. Chem. 2010, 314671–690. [DOI] [PMC free article] [PubMed] [Google Scholar]
- Phillips J. C.; Braun R.; Wang W.; Gumbart J.; Tajkhorshid E.; Villa E.; Chipot C.; Skeel R. D.; Kalé L.; Schulten K. Scalable molecular dynamics with NAMD. J. Comput. Chem. 2005, 26161781–1802. [DOI] [PMC free article] [PubMed] [Google Scholar]
- Loch J. I.; Polit A.; Bonarek P.; Olszewska D.; Kurpiewska K.; Dziedzicka-Wasylewska M.; Lewiński K. Structural and thermodynamic studies of binding saturated fatty acids to bovine β-lactoglobulin. Int. J. Biol. Macromol. 2012, 5041095–1102. [DOI] [PubMed] [Google Scholar]
- Loch J.; Polit A.; Górecki A.; Bonarek P.; Kurpiewska K.; Dziedzicka-Wasylewska M.; Lewiński K. Two modes of fatty acid binding to bovine β-lactoglobulin—crystallographic and spectroscopic studies. J. Mol. Recognit. 2011, 242341–349. [DOI] [PubMed] [Google Scholar]
- Andújar-Sánchez M.; Smith A. W.; Clemente-Jimenez J. M.; Rodriguez-Vico F.; Las Heras-Vazquez F. J.; Jara-Pérez V.; Cámara-Artigas A. Crystallographic and Thermodynamic Analysis of the Binding of S-Octylglutathione to the Tyr 7 to Phe Mutant of Glutathione S-Transferase from Schistosoma japonicum. Biochemistry 2005, 4441174–1183. [DOI] [PubMed] [Google Scholar]
- Andújar-Sánchez M.; Clemente-Jiménez J. M.; Las Heras-Vázquez F. J.; Rodríguez-Vico F.; Cámara-Artigas A.; Jara-Pérez V. Thermodynamics of glutathione binding to the tyrosine 7 to phenylalanine mutant of glutathione S-transferase from Schistosoma japonicum. Int. J. Biol. Macromol. 2003, 323–577–82. [DOI] [PubMed] [Google Scholar]
Associated Data
This section collects any data citations, data availability statements, or supplementary materials included in this article.


