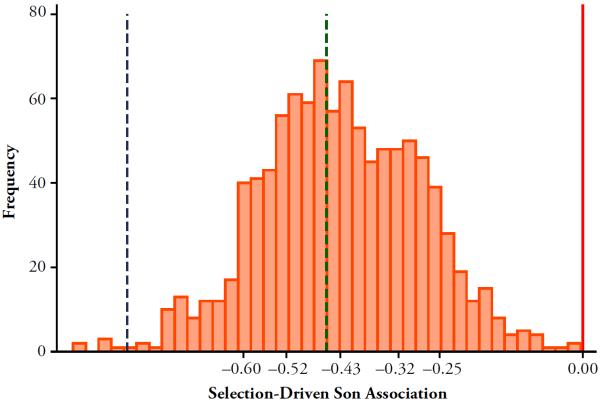
Fig. 3.
Simulation results: Cross-sectional analyses, base parameter values. We executed the simulation tool 1,000 times, using the base parameter vector outlined in Table 2 (and in the series traced by the solid lines in Fig. 1) each time. At the end of each execution, we randomly drew one time period for each couple and dropped all childless couples. This mimics the process of drawing data on parents with children from a cross-sectional data set like the census. Using a linear probability regression, we then estimated the difference in risk of having divorced as a function of sex of the first birth. The regression equation is described in the text (Eq. (4)); it mimics the analyses reported in studies such as those reported in the bottom panel of Table 1. That exercise generated 1,000 risk differences ( in the regression equation): one for each execution of the simulation tool. This histogram shows the distribution of the 1,000 values. The 10th percentile, 25th percentile, mean, 75th percentile, and 90th percentile are marked and labeled on the horizontal-axis, and the vertical solid line is at 0. Dotted vertical lines indicate reported effect sizes from two of the studies cited in the bottom panel of Table 1

