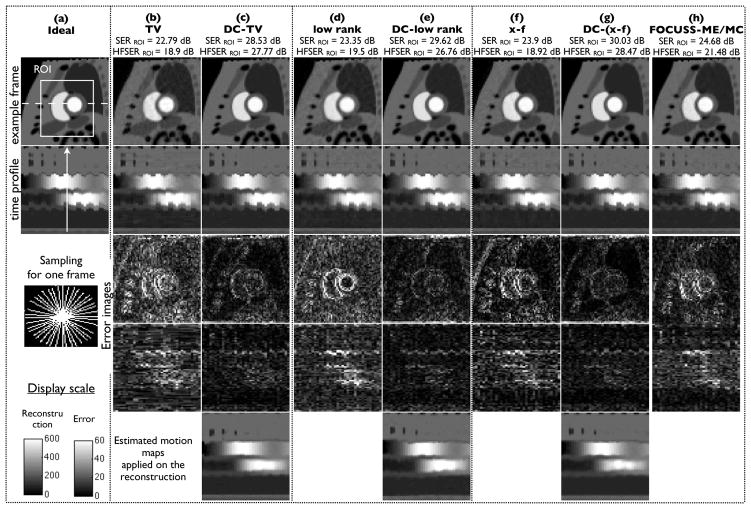
Fig. 4.
Qualitative comparison on the PINCAT phantom data using 20 rays/frame: We show for each of the schemes a spatial frame, its image time profile, and the corresponding difference images and difference time profiles. The difference images are scaled up by a factor of 10 for better visualization. The time profile in the second row corresponds to the profile along the dotted line in the first image frame of the top row. The location of the image frame is depicted by the arrow in the time profile of (a). As depicted from these figures, DC-CS provides superior reconstructions compared to CS with regards to reduced motion artifacts. The motion compensated time profiles shown in the bottom row depicts that the proposed algorithm was capable to estimate and correct most of the inter-frame motion.

