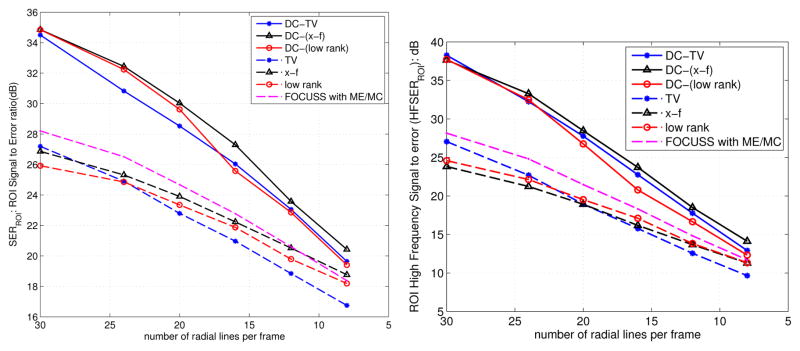
Fig. 5.

Quantitative comparisons of different schemes using (a) the signal to error ratio, and the (b) high frequency signal to error metrics on PINCAT phantom data. These metrics are evaluated in a square field of view that contains regions of heart as depicted in Fig. 4. These plots demonstrate that the DC-CS schemes outperform the CS schemes at all sub-sampling factors.
