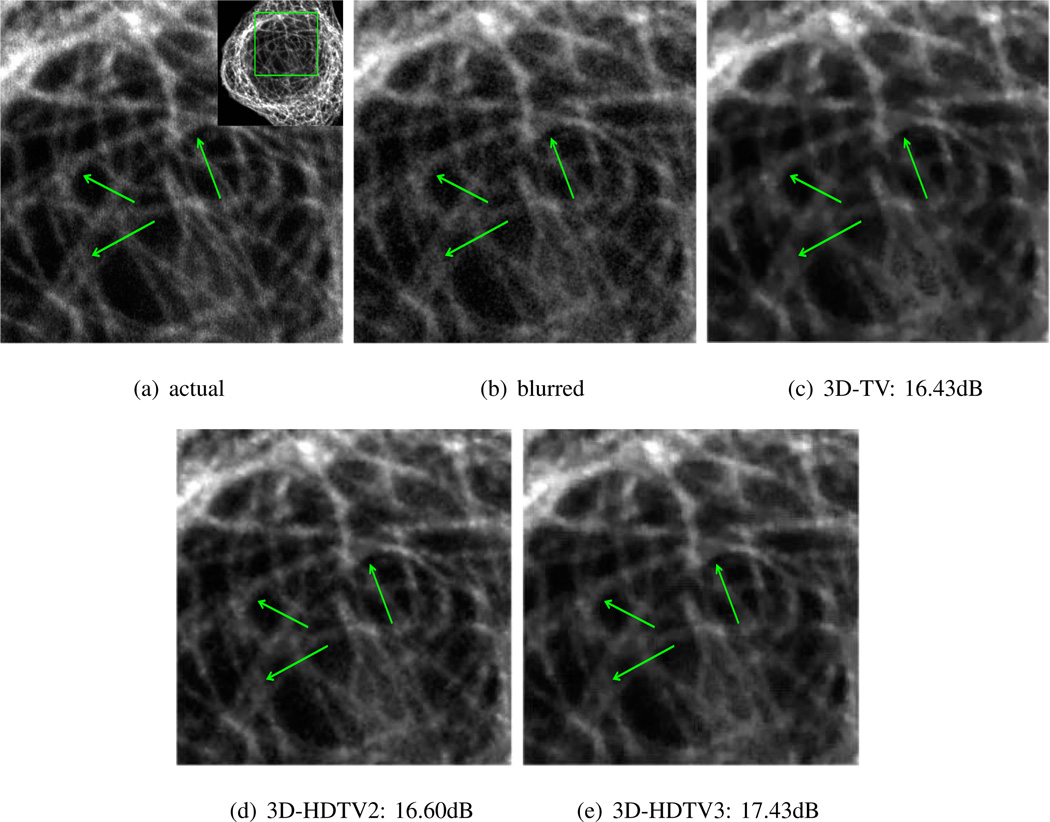
Figure 8.
Deconvolution of a 3D fluorescence microscope dataset. (a) is the original image. (b) is the blurred image using a Gaussian filter with standard deviation of 1 and size 5 × 5 × 5 with additive Gaussian noise (σ = 0.01). (c) to (e) are deblurred images using 3D-TV, 3D-HDTV2, 3D-HDTV3, separately. We observe that the 3D-TV recovery is very patchy and some small details are lost, while the HDTV methods preserve the line-like features (indicated by green arrows) with a 0.2 dB improvement in SNR.

