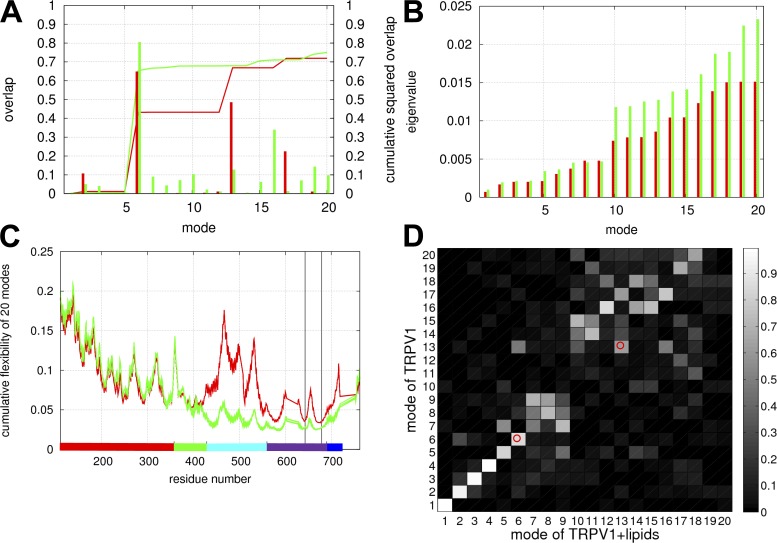
Figure 2.
Results of NMA for the lowest 20 modes calculated in the absence (red) or presence (green) of lipids. (A) The overlap and cumulative squared overlap as a function of mode number (shown as impulses and lines, respectively). (B) The eigenvalue as a function of mode number. (C) The cumulative flexibility as a function of residue number. (D) The all-to-all pairwise overlaps between the modes calculated in the absence or presence of lipids (with high/low overlap corresponding to light/dark gray). In C, the ranges of residue numbers are colored as follows: red, ARD; green, MPD; cyan, S1–S4 helices; purple, S5–S6 helices; blue, CTD. The positions of residue G643 and I679 are marked by vertical lines. In D, the two cells corresponding to the overlaps of modes 6 and 13 are marked by small circles.

