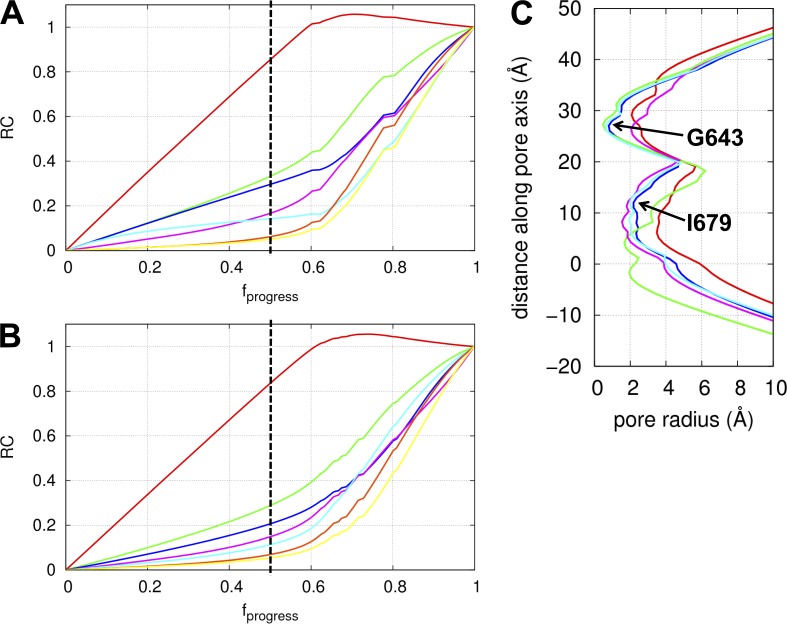
Figure 3.
Results of the transition pathway modeling in the absence or presence of lipids. (A) Reaction coordinates along the closed-to-open transition pathway (calculated in the absence of lipids) for the following functional parts of TRPV1: ARD (red), MPD (green), CTD (blue), helices S1–S4 (cyan), helices S5–S6 (purple), and residues G643 (orange) and I679 (yellow). (B) Reaction coordinates along the closed-to-open transition pathway (calculated in the presence of lipids; same color scheme as A). (C) Pore radius as a function of distance along the pore axis for the C-state structure (blue; PDB accession no. 3J5P), O-state structure (red; PDB accession no. 3J5Q), capsaicin-bound structure (green; PDB accession no. 3J5R), and the ICD-activated model of TRPV1 calculated in the absence of lipids (purple) and presence of lipids (cyan). The two constrictions at residues G643 and I679 are shown. This calculation was done using the HOLE program (Smart et al., 1996).

