
Figure 4.
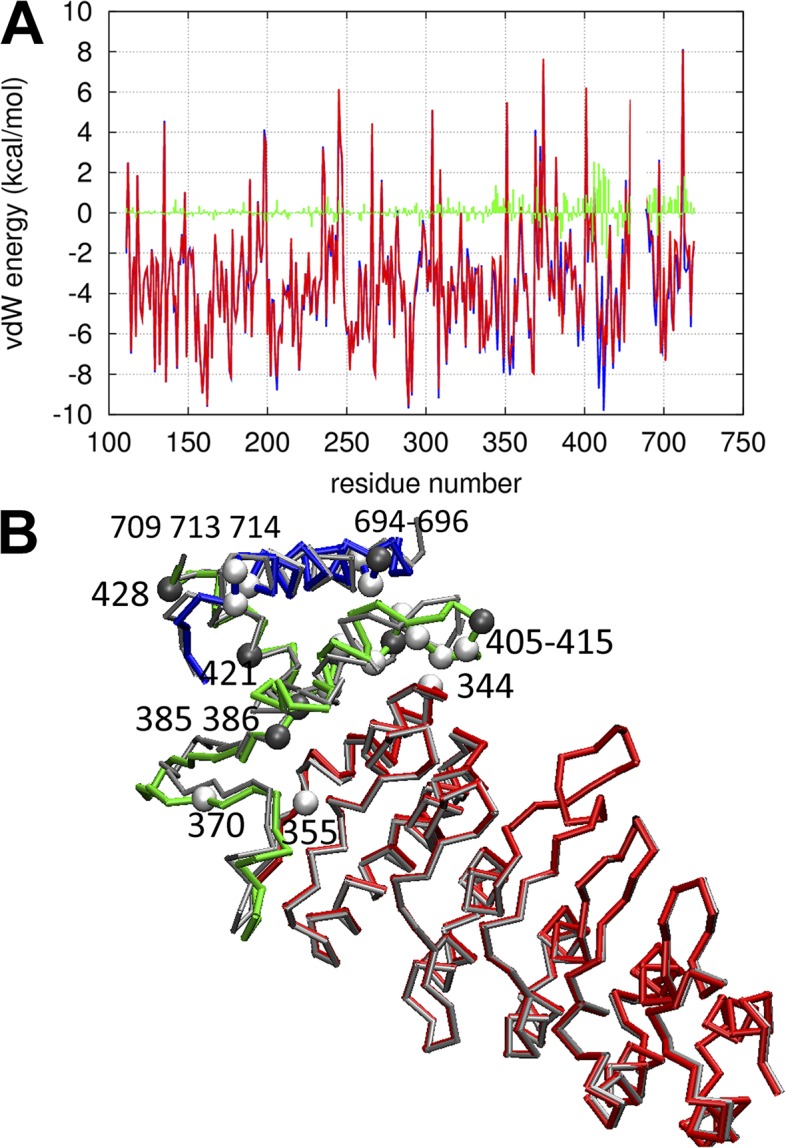
Results of MD-based energetic analysis. (A) vdW energy as a function of residue position for: C state (blue), O sate (red), and difference between C and O state (green). (B) Key residues in the ICD identified by energetic analysis: the backbone trace of the C-state structure is colored as follows: red, ARD; green, MPD; blue, CTD. The backbone trace of the O-state structure is colored in gray; residues with significantly higher (lower) vdW energy in the O state than the C state are shown as spheres colored white (dark gray).