Figure 3.
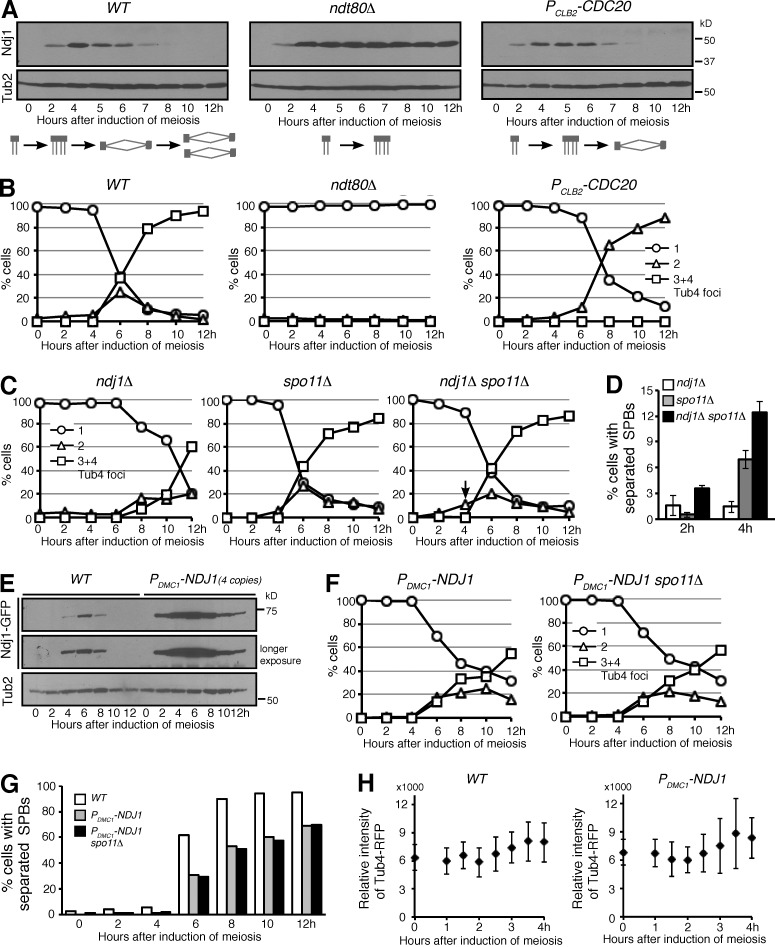
Ndj1 regulates SPB separation during yeast meiosis. Yeast cells were induced to undergo synchronous meiosis; aliquots were withdrawn at the indicated times for immunoblotting (A and E) and for microscopy (B, C, F, G, and H). (A) Ndj1 protein level in wild-type (WT, HY3937), ndt80Δ (HY3973), and PCLB2-CDC20 (HY4031) cells. Ndj1 was tagged with 3×HA and probed with an anti-HA antibody. The level of Tub2, β-tubulin in yeast, serves as a loading control. Schematic diagrams at the bottom show SPB dynamics in these cells. (B) Quantification of SPB separation in WT (HY1635), ndt80Δ (HY4115), and PCLB2-CDC20 (HY4113) cells. Tub4-RFP was used as the SPB marker. Before their separation, duplicated SPBs were observed as a single Tub4-RFP focus. The graphs shown are from a representative time-lapse experiment out of three repeats. (C and D) Quantification of SPB separation in ndj1Δ (HY3945), spo11Δ (HY4133), and ndj1Δ spo11Δ (HY4204) cells. SPBs were marked by Tub4-RFP as in B. The arrow indicates premature SPB separation. The p-values for strains spo11Δ and ndj1Δ spo11Δ are <0.05 at both 2 h and 4 h. The graphs shown in C are from a representative time-lapse experiment out of three repeats. Error bars indicate standard deviation. (E) Overproduction of Ndj1 in yeast meiosis (HY4860). Four copies of PDMC1-GFP-NDJ1 were inserted into the yeast genome to overexpress NDJ1. Ndj1 was tagged with GFP and probed with an anti-GFP antibody. The level of Tub2 serves as a loading control. (F and G) Quantification of SPB separation in WT (HY1635), PDMC1-NDJ1 (HY4860), and PDMC1-NDJ1 spo11Δ (HY4861) cells. SPBs were marked by Tub4-RFP as in B. Note that overexpression of NDJ1 delays SPB separation. The p-values for WT and PDMC1-NDJ1 are <0.01 6 h after induction of meiosis. The data shown are from a representative time-lapse experiment out of three repeats. (H) Fluorescence-based assay of SPB duplication in WT (HY1635) and PDMC1-NDJ1 (HY4860) cells during meiosis. The intensity of Tub4-RFP from single optical sections was determined and plotted over time. The mean intensity of Tub4-RFP between WT and PDMC1-NDJ1 is not significantly different as determined by Student’s t tests (P > 0.05).

